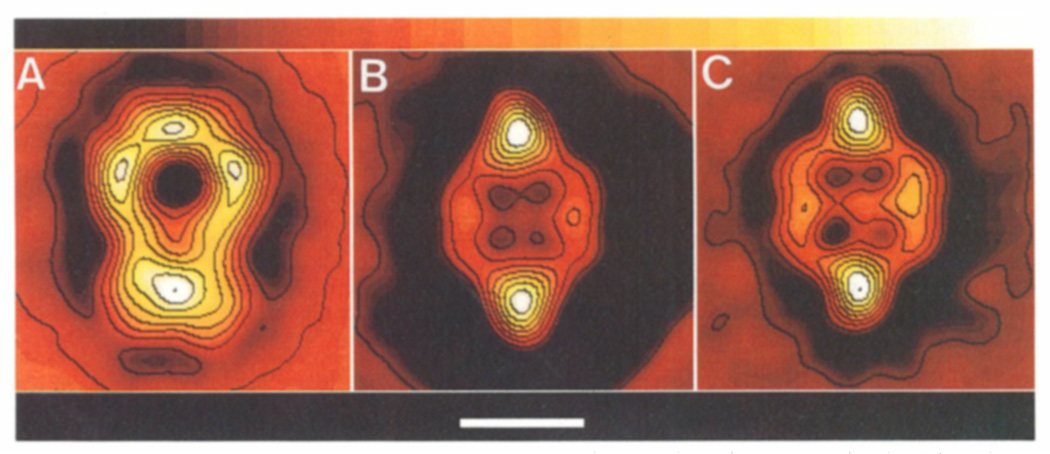
FIG. 3.
Average images from the stained α2M molecules derived from the carbon-coated Butvar film in padlock (A) and lip (B) views and from unstained molecules in the lip view (C). The bar corresponds to 100 Å, the color bar at the top of the figure shows the progression of protein density from low (dark) to high (white). Image processing of the molecules on the Butvar film was made difficult because of the variable orientations between the padlock and lip views.

