Fig. 1.

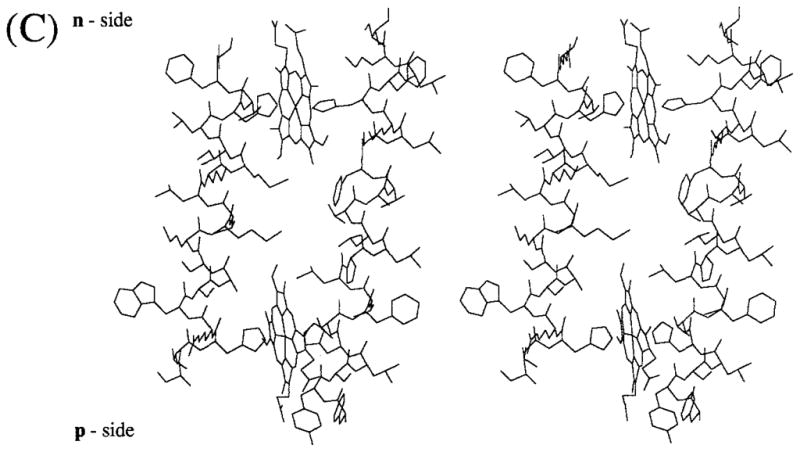
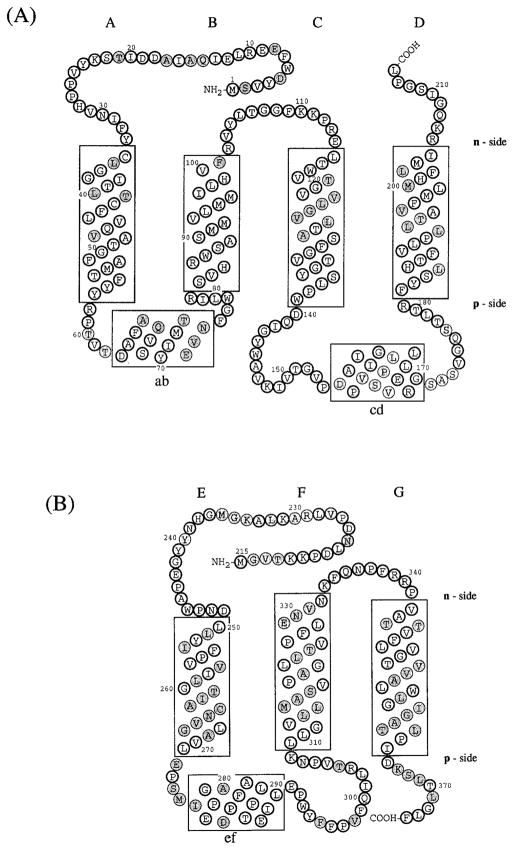
Folding pattern across the thylakoid membrane of (A) cytochrome b6 and (B) subunit IV predicted by the distribution and conservation in the 13 and 16 sequences shown in Table IA, B of long (ca. 20 residue) hydrophobic segments. The hydrophobic membrane bilayer is delineated by the rectangular boxes. Hatched circles represent residues that are not invariant or pseudo-invariant. (C) Molecular model (stereo view) of heme-bridged helices B and D of spinach cyt b6. The amino acid sequences of these helices are: B helix, NH2 (p-side)- SVHRWSASMMVLMMILHVF-COOH; D helix, NH2 (p-side)-FYSLHTFVLPLLTAVFMLMHFLMI-COOH. Nomenclature: (1) The two sides of the membrane are designated n- and p-, the electrochemically negative and positive sides, which correspond to stroma and lumen, respectively, in the case of chloroplast thylakoid membranes. This notation is chosen instead of i and o proposed in the recent review of Degli Esposti et al. (1993) because it is conceptually simple, which is important for teaching purposes, allows comparative discussion of bacteria, chloroplasts, and mitochondria without reference to the definition of all of the respective extramembrane compartments (lumen, matrix, cytoplasmic, stroma, intermembrane, periplasmic), and is unambiguous, unlike i and o which can readily be mistaken by nonspecialists for “inside” and “outside.” (2) Putative trans-membrane helices and connecting peripheral domains are labeled A – G and ab…fg, respectively, according to the proposal of Crofts et al. (1990). (3) Cytochrome b hemes on the n- and p-sides of membrane coordinated by His-99 and His-201 and His-85 and His-186, respectively, bridging helices B and D, are designated hemes bn and bp, respectively. The notation is preferred over that of bh and bl, for high- and low-potential hemes, proposed by Degli Esposti et al. (1993) because (a) there is experimental disagreement for cyt b6 in situ concerning the existence of experimentally resolvable high- and low-potential b hemes, and (b) the redox titration of cyt b of the bc1 complex from the PS3 thermophilic bacterium, which shows some similarity to the b6f complex, does not show a discernible difference in Em of the two hemes (Kutoh and Sone, 1988). Regarding (a), two reports (Furbacher et al., I989; Rich et al., 1991) show that the Em values of the two hemes are not separately resolved (ΔEm < 50mV) in thylakoid membranes in the presence of Mg2+; one (Kramer and Crofts, 1990) showed potentiometric resolution (bh = −15 mV, bl = −110 mV, ΔEm = 95 mV) of the two hemes. The latter result was obtained in the absence of Mg2+ but is in close agreement with the heme potentials measured in the isolated b6f complex (Hurt and Hauska, 1983; Nitschke et al., 1988). It was proposed (Kramer and Crofts, 1990) that the use of a continuous high-measuring light intensity in the redox titrations of Girvin and Cramer (1984) and Furbacher et al. (1989) might account for the discrepancy, but the intensity (0.6 μE · m−2 sec−1) found by Kramer and Crofts (1990) to cause cytochrome oxidation was at least 30 times that used (10–20 nE · m−2 · sec−1) by the latter authors.

