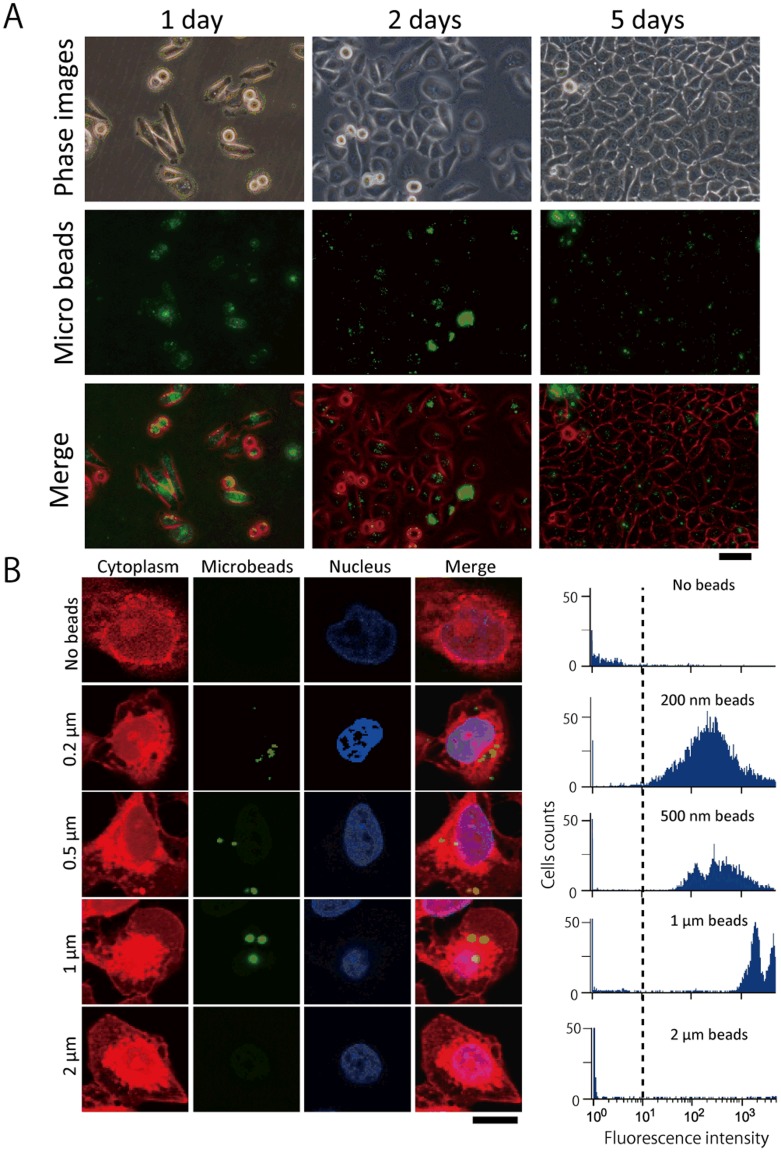
Figure 2. Representative images of cultured HeLa cells containing fluorescent microbeads introduced by cell–GUV electrofusion.
(A) Microscopic images of cells that had been cultured for 1 (left column), 2 (middle column), or 5 (right column) days after the electrofusion process. The diameter of the beads used here was 0.2 µm. Phase contrast gray scale images were converted to red-scale. Scale bar = 50 µm. (B) Fluorescent beads with various diameters were introduced into HeLa cells by cell–GUV electrofusion. Left: Confocal microscopic images show the cross-section of the treated HeLa cells. These images show HeLa cells into which (from the top) no beads, or beads of 0.2 µm, 0.5 µm, 1 µm, and 2 µm diameter (green) had been introduced. The cytoplasm is shown in red and nuclei in blue, and merged images are shown in the right column. Scale bar = 10 µm. Right: Flow cytometric detection of microbeads introduced into HeLa cells. Single parameter histograms of the cell number versus log fluorescence intensity are shown. The histograms represent a total of 7,000–15,000 cells counted for each measurement.

