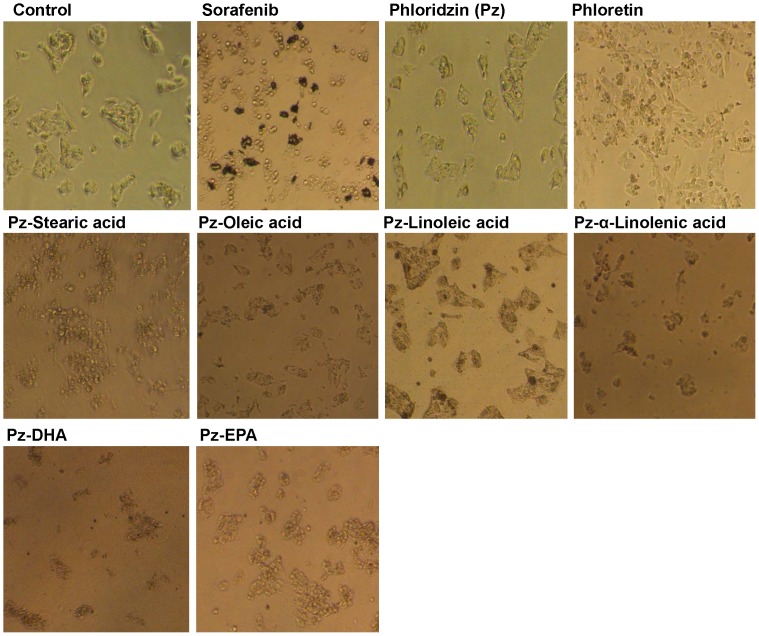
Figure 3. Inverted phase contrast microscopy images of HepG2 cells.
The cells were cultured (2×10⁴ cells/100 µL) in 96 well plate after incubation with 100 µM of fatty acid esters of phloridzin (Pz) in comparison with parent compounds phloridzin, phloretin (aglycone) or liver cancer drug sorafenib for 24 h. Shown are representative images of three independent experiments.

