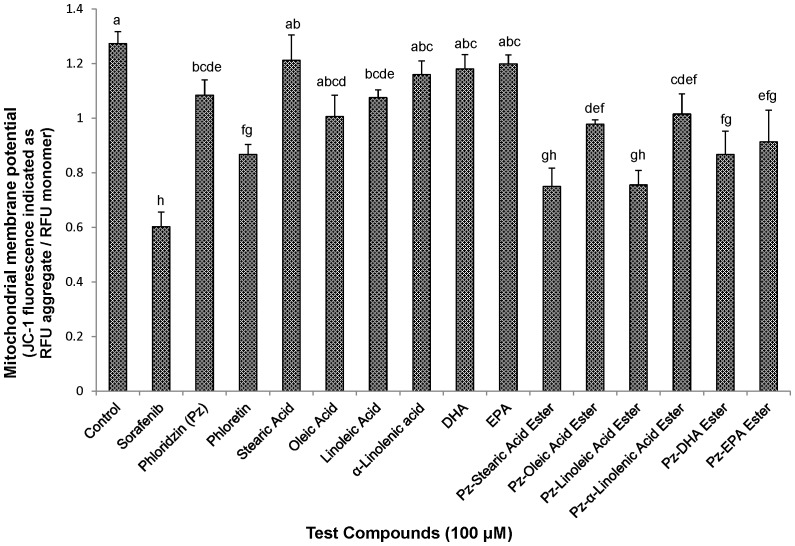
Figure 7. Mitochondrial membrane potential (Δψm) of HepG2 cells measured by JC-1 fluorescence.
HepG2 cells were treated with 100 µM of fatty acid esters of phloridzin (Pz) in comparison with parent compounds phloridzin, individual fatty acids, phloretin (aglycone) or liver cancer drug sorafenib for 24 h. The fluorescence of JC-1 monomers was measured at em 535 nm and aggregates at em 590 nm. Data are presented as the mean ± SD (n = 3) are representative of at least three separate independent experiments. Different letters represent significantly different mean values from other treatments (Tukey HSD, P<0.01).

