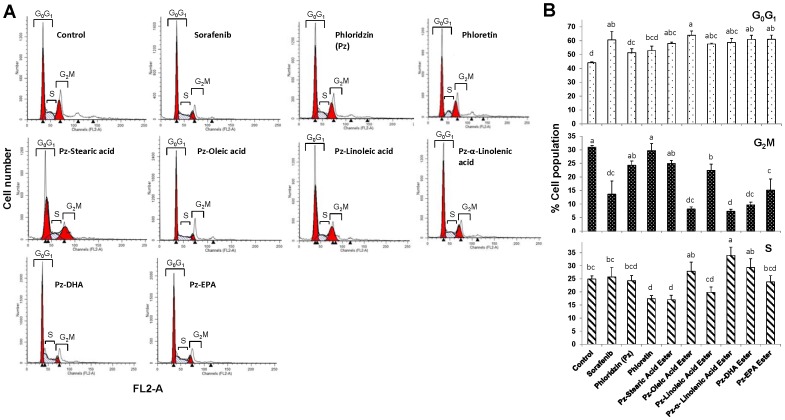
Figure 9. Evaluation of cell cycle in HepG2 cells using the propidium iodide assay.
HepG2 cells were treated with 100 µM of fatty acid esters of phloridzin (Pz), pz or phloretin or sorafneib for 24 h, and then cell cycle profile was determined using flow cytometry after staining with PI/RNase. Representative FACS histograms of nuclear DNA content are shown (A). The DNA content peaks indicating cells in the G0G1, S, or G2/M phase of the cell cycle are marked. The bar chart show the changes in percentages (mean ± SD) of cells in G0/G1, S-phase, and G2/M after treatment (B). Data are presented as the mean ± SD (n = 3) are representative of three separate independent experiments. Different letters represent significantly different mean values from other treatments (Tukey HSD, P<0.01).

