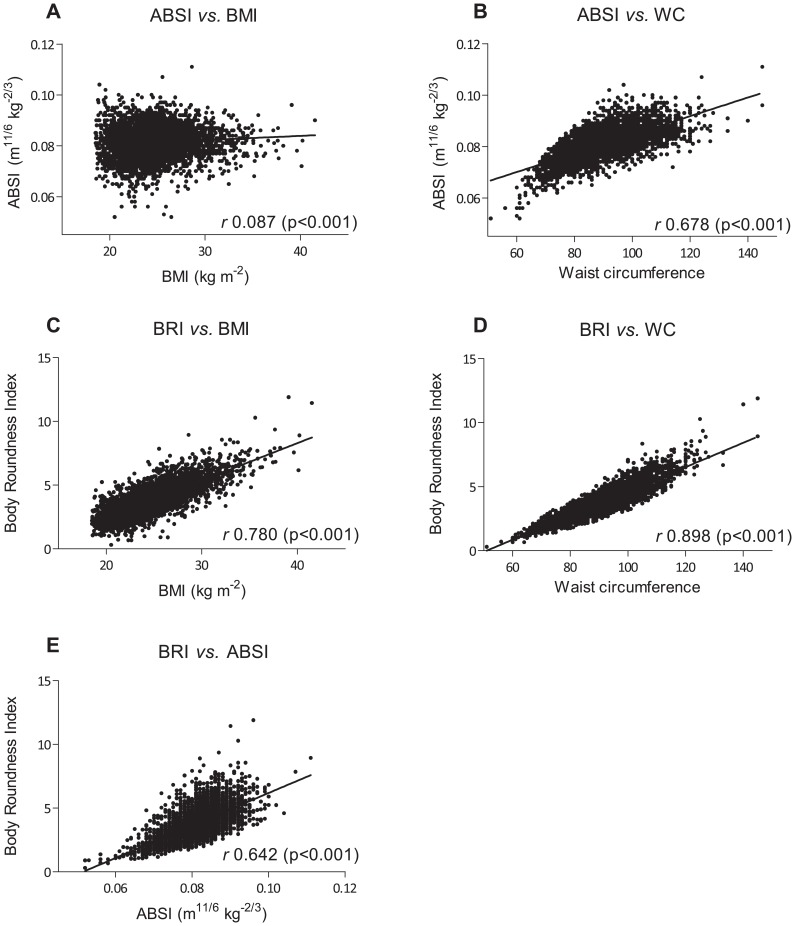
Figure 2. Correlations between ABSI, BMI, BRI, and WC.
A. Correlation between ABSI and BMI. Increase in ABSI and increase in BMI show a poor yet significant correlation (r = 0.087, P<0.001). B. Correlation between ABSI and WC. Increase in ABSI and increase in WC show a significant correlation (r = 0.678, P<0.001). C. Correlation between BRI and BMI. Increase in BRI and increase in BMI show a significant correlation (r = 0.780, P<0.001). D. Correlation between BRI and WC. Increase in BRI and increase in WC show a significant correlation (r = 0.898, P<0.001). E. Correlation between BRI and ABSI. Increase in BRI and increase in ABSI show a significant correlation (r = 0.642, P<0.001).

