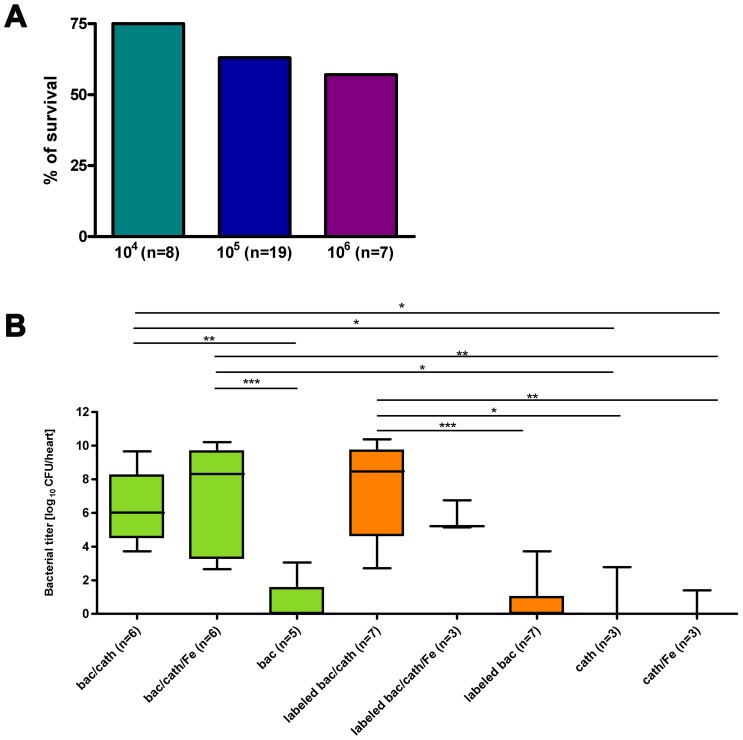
Figure 2. Feasibility of the endocarditis model.
(A) Survival rate 24 h after infection with different concentrations of bacteria (104, 105 and 106 CFU) for an initial group of mice. (B) Bacterial titer on the valves 24 h after infection with 105 CFU for the different groups used in this study. Groups were: mice with permanent catheter and infection with unlabeled bacteria (bac/cath); permanent catheter, infection with unlabeled bacteria and additional VSOP administration (bac/cath/Fe); sham surgery and infection with unlabeled bacteria (bac); permanent catheter and infection with VSOP-labeled bacteria (labeled bac/cath); permanent catheter, infection with VSOP-labeled bacteria and additional VSOP administration (labeleld bac/cath/Fe); sham surgery and infection with labeled bacteria (labeled bac); permanent catheter only (cath); permanent catheter and additional VSOP administration (cath/Fe). Box plots show median, 25th and 75th percentiles and extreme values. Significant differences are indicated: * p<0.05, ** p<0.01, *** p<0.001.

