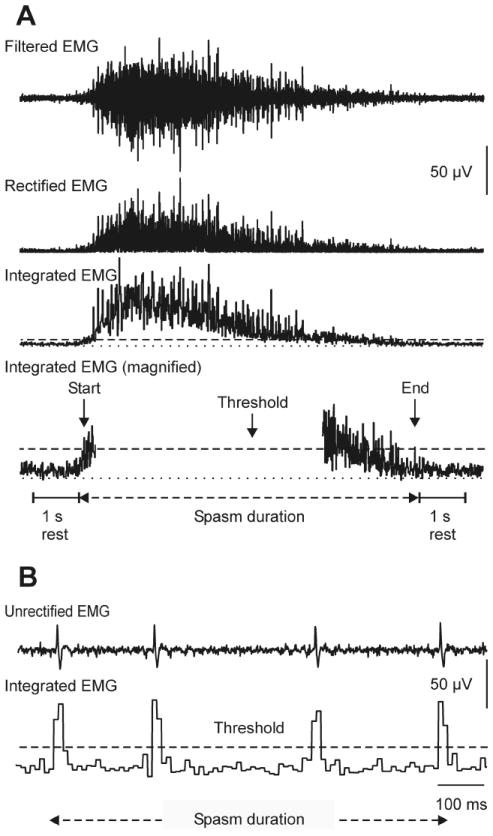
Fig. 1.

(A) EMG data were software-filtered (cascaded 30 Hz high-pass; 60 Hz FIR filters; basic windowed linear-phase Finite Impulse Response digital filters of order 472; Mummidisetty et al., 2012), rectified, and integrated every 10 ms. Integrals above-threshold (dashed line) distinguished EMG from baseline. There was one second of rest between spasms. Spasm duration was determined by threshold crossings. EMG formed an interference pattern, indicating a tonic spasm. (B) Distinct motor unit potentials signified a unit spasm.
