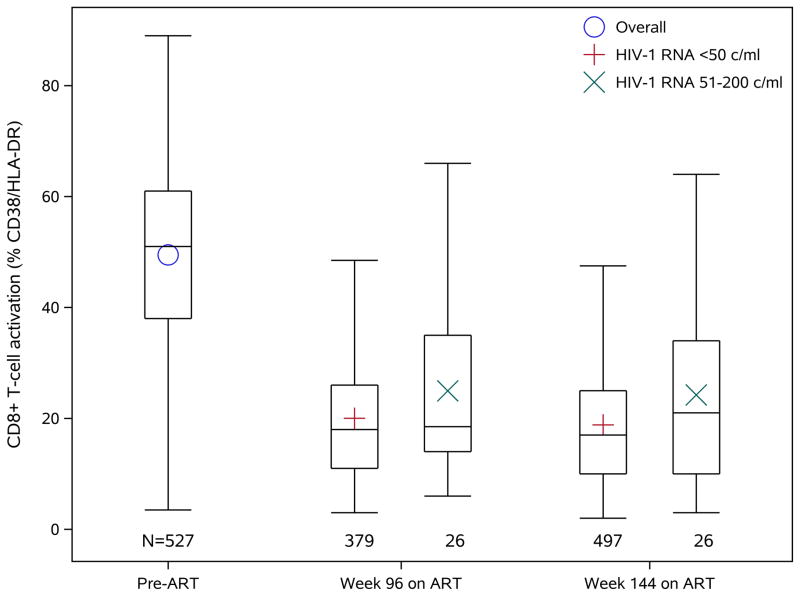
Figure 1.
CD8+ T-cell activation (% co-expressing CD38/HLA-DR) levels pre-ART and at 96 and 144 weeks on ART. Top and bottom of the box represent the lower and upper quartiles. The bar and the symbol inside the box represent the median and the mean, respectively. The whiskers extend to the furthest measurement within 1.5 times the interquartile range from the upper or lower quartile.

