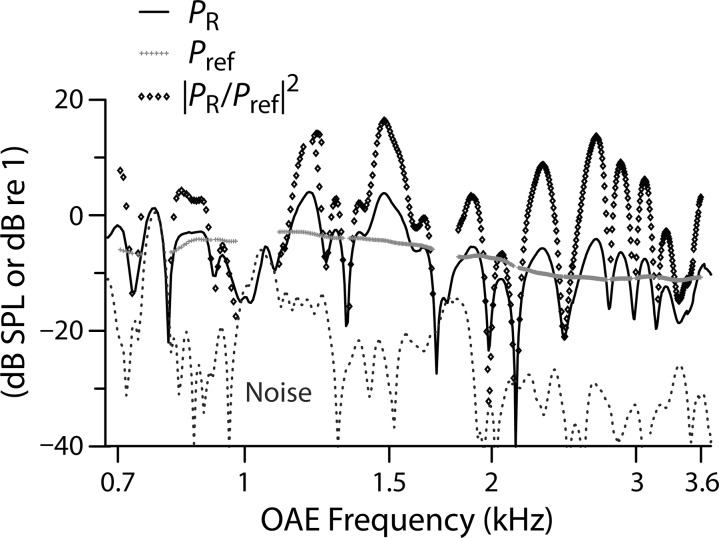
FIG. 2.
Energy-weighting procedure illustrated in another young-adult subject. During the computation of the loess trend, delay values are weighted by R-component energy, defined as |PR/Pref|.2 The solid and dashed lines show the R-component level (PR in dB SPL) and noise floor, respectively. The gray symbols show the level of the local reference pressure, Pref, obtained by smoothing the R-component level. The diamonds give the local energy |PR/Pref|2 (in dB re 1).

