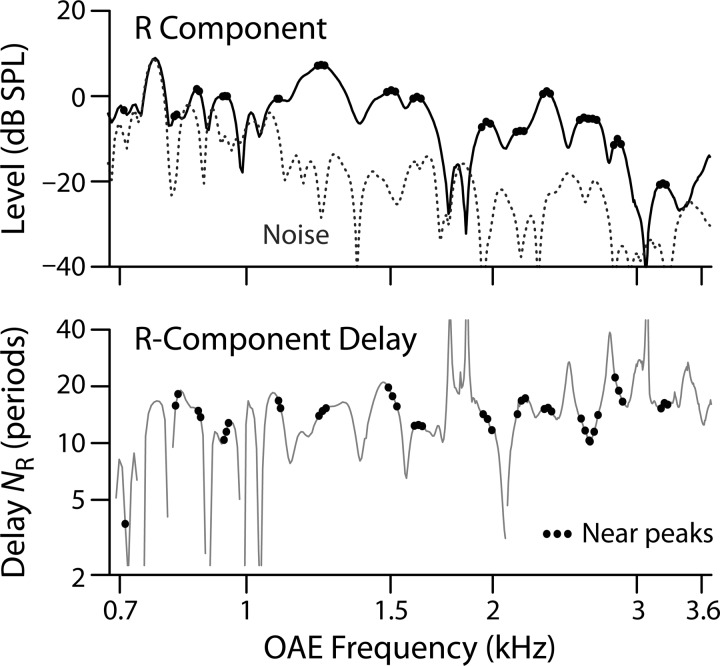
FIG. 3.
Peak-picking procedure illustrated using data from one elderly subject. When computing the loess trend, only delay data (bottom panel) near local maxima in the R-component level (top panel) are employed. In both panels, data at frequencies straddling the magnitude peaks are marked with small dots.

