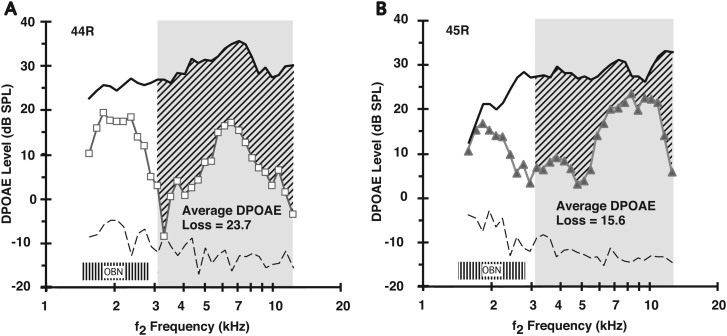
FIG. 4.
Average amount of noise-induced loss in DPOAE levels was variable in different rabbits. The average DPOAE loss was plotted as a function of the f2 frequency to compute a DPOAE-loss index for each rabbit, here shown for both 44 R (A: open squares) and 45 R (B: closed triangles). Rabbit 44 R, which exhibited an average DPOAE-adaptation index of 1.5 [see Fig. 2(A)], showed an appreciable OBN-induced DPOAE loss at 23.7 dB. In contrast, rabbit 45 R, which displayed a more hardy average DPOAE-adaptation index of 8.6 [Fig. 2(C)], showed a lesser noise-induced average loss of 15.6 dB. The shaded “OBN” box around 2 kHz represents the 2-kHz OBN exposure.

