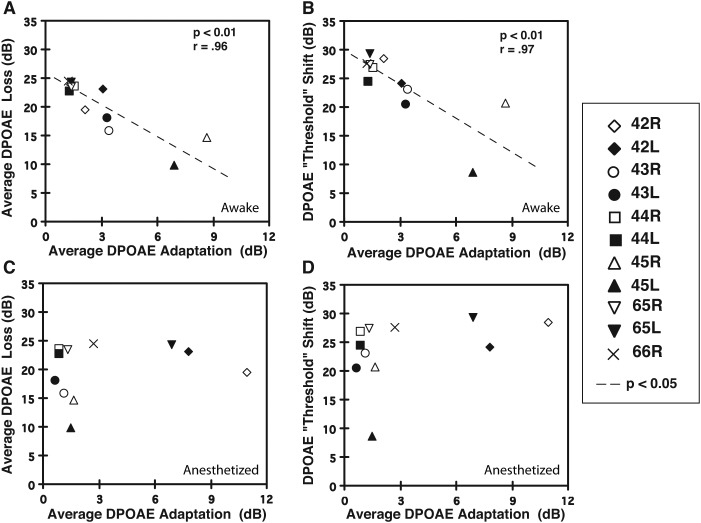
FIG. 5.
Relationship of the average DPOAE-adaptation index to the average DPOAE-loss value that estimated the amount of adverse effects on emissions produced by the OBN exposure. (A) For all rabbits, the average DPOAE-adaptation index computed while awake predicted the amount of noise-induced decrement in DPOAE levels in that there was an inverse correlation between the adaptive-index value and the value representing the average DPOAE loss. (B) A similar outcome occurred when measuring the OBN-induced DPOAE “threshold” shift. That is, the average DPOAE-adaptation index measured for the awake rabbit was inversely related to the amount of “threshold” shift, with larger indices (e.g., rabbit 45 L = filled triangle) associated with small threshold shifts, and smaller indices (e.g., rabbit 44 R = open square) associated with large threshold shifts. (C) In anesthetized rabbits, the average DPOAE-adaptation index did not predict the amount of noise-induced loss in DPOAE levels. (D) Similarly, DPOAE-adaptation indices determined while the animal was anesthetized, did not predict the amount of DPOAE threshold shift. Note that statistical correlations were based on the mean value for the left and right ears of individual rabbits. Symbols missing in these plots represent instances in which the overlay of data points prevented data for individual ears to be distinguished.

