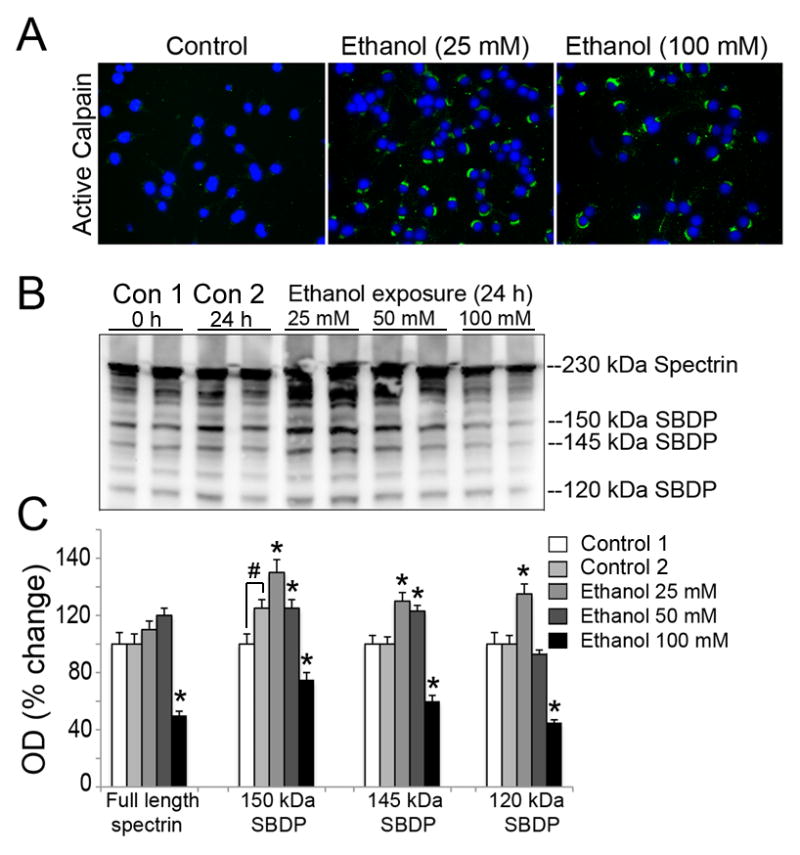
Figure 3.

EtOH-induced μ-calpain activation in motoneurons. (A) Representative images of active μ-calpain (green) and nuclei counterstained (blue) from three independent experiment (n = 3) illustrate that active μ-calpain IR is significantly increased in motoneuronal cytoplasm after EtOH exposure (a low 25 mM concentration), compared to control cells and remained expressed at 100 mM EtOH in surviving cells. (B) Representative immunoblots and corresponding bar graphs (C) from three independent experiment (n = 3) showing 230 kDa full length αII-spectrin, 150 and 145 kDa calpain specific SBDPs, and 120 kDa caspase-3 specific SBDP. Control 1 represented the differentiated motoneurons collected at 0 h whereas in control 2 motoneurons were incubated in reduced serum condition (0.5%) parallel to those being exposed to EtOH for 24 h. Control 1 and 2 had significantly altered levels of 150 kDa SBDP. All EtOH-exposed cells were compared to ‘Control 2’ in Figure 3. Bar graphs indicate the increase in levels of SBDPs (↑) in motoneurons after EtOH exposure due to calpain and caspase-3 activation. Data are expressed as mean ± SEM; n ≥ 3; *p ≤ 0.05, significantly different from control 2.
