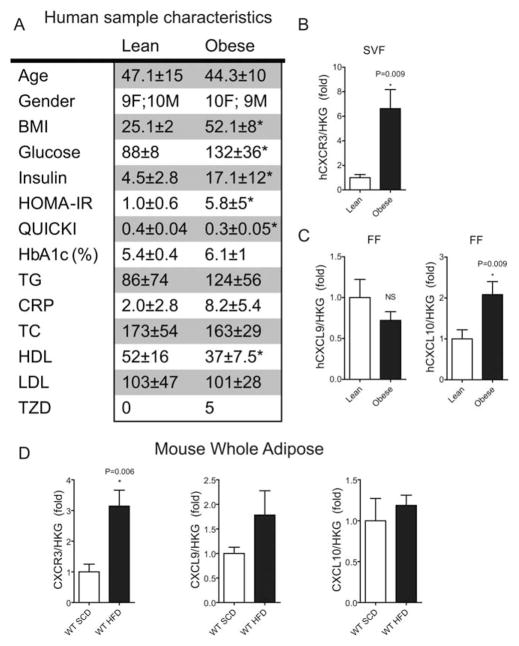
FIGURE 1.
CXCR3 expression in human and mouse adipose. (A) Table 1. Human sample characteristics: All values are mean ± SEM where applicable; * P < 0.05 via student t-test; CRP (c-reactive protein), glucose, and lipid panel constituents are in mg/dl; Insulin is μIU/ml; TZD, count of patients using thiazolidinedione drugs; TC, total cholesterol. (B) CXCR3 gene expression using real-time PCR in the stromal vascular fraction (SVF) of human adipose tissue from Table 1. (C) CXCL9 and CXCL10 gene expression using real-time PCR in the FF from human adipose tissue from Table 1. (D) Mouse CXCR3, CXCL9, CXCL10 gene expression in whole adipose tissue of C57BL/6J mice fed a standard chow diet (SCD) and HFD as measured using real-time PCR.

