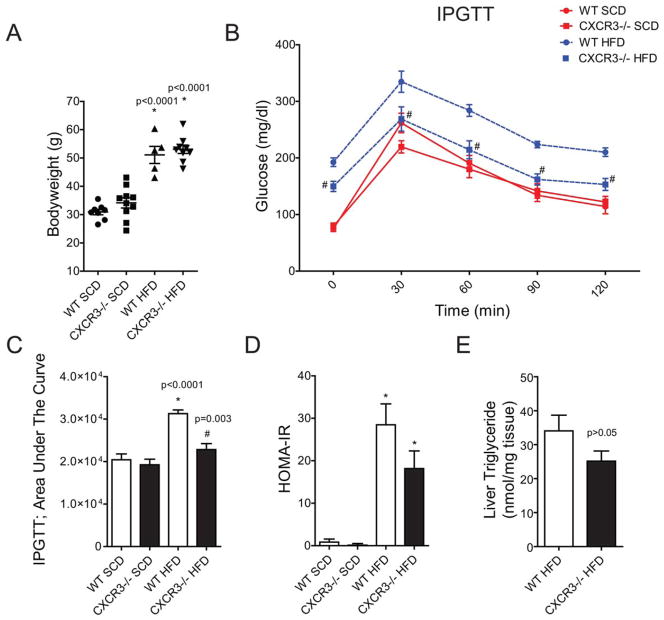
FIGURE 2.
Loss of CXCR3 partially protects systemic glucose control in obesity. (A) Body weights at time of sacrifice. (B). Intraperitoneal glucose tolerance test (IPGTT) results after long-term HFD or SCD. WT mice are represented by a circle (●). CXCR3−/− mice are represented by a square (■). Diet is color and line coded: SCD is a red, solid line; HFD is a blue, broken line. Zero minutes represent plasma glucose after a 16-hour fast. (C) AUC was calculated for the IPGTT data using Graphpad Prism 5. (D) Homeostatic model assessment-estimated insulin resistance (HOMA-IR) calculations based on fasting glucose and insulin measures in mice at time of sacrifice. Values are mean ± SEM. *Indicates comparison to SCD control of the same genotype. #Indicates comparison of WT-HFD vs CXCR3−/−-HFD. (E) Liver triglyceride measures in WT and CXCR3−/− HFD mice at experiment end. [Color figure can be viewed in the online issue, which is available at wileyonlinelibrary.com.]

