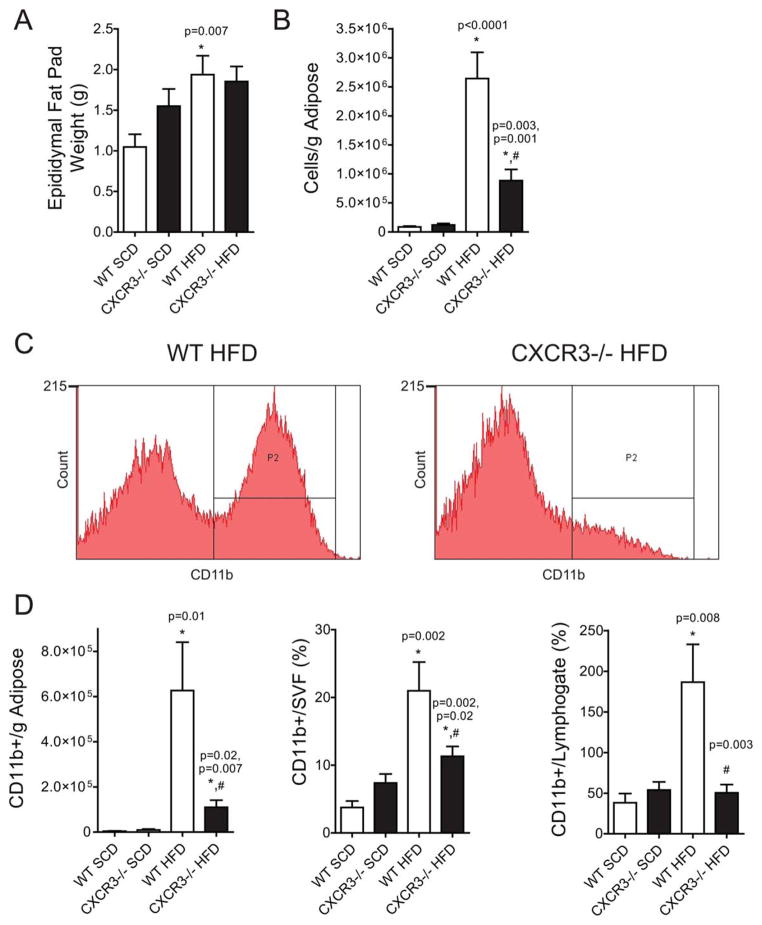
FIGURE 3.
VAT macrophage-response to HFD is dramatically decreased in CXCR3−/− mice. (A) Epididymal fat pad weights of killed mice used in flow cytometry experiments. (B) Approximate leukocyte cell count per gram of epididymal adipose (A) after tissue dissociation. (C) Representative flow cytometry figures of CD11b+ cells in the epididymal adipose. y-Axis represents cell count; x-axis represents fluorescent intensity. (D) Compiled and analyzed flow cytometric data expressed in bar graphs. Content expressed as quantity per gram of adipose or as percent of a larger gate. “Lymphogate” are those cells identified as T cells. [Color figure can be viewed in the online issue, which is available at wileyonlinelibrary.com.]

