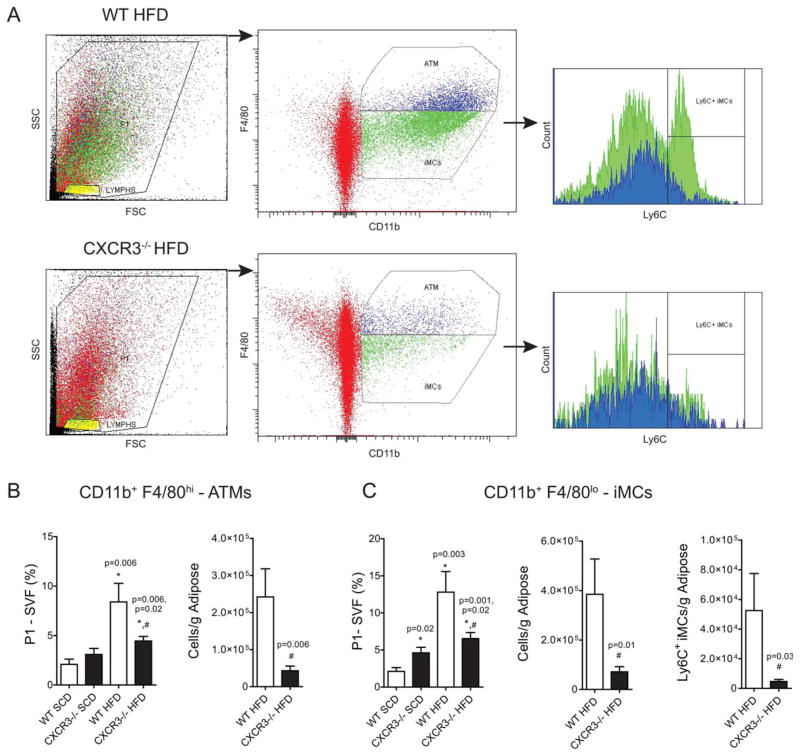
FIGURE 4.
Increased activation of immature myeloid cells and mature macrophages in obesity, mitigation in obese CXCR3−/− mice. (A) Representative flow cytometry figures depicting gating strategy for identification of VAT macrophages (ATMs) and immature myeloid cells (iMCs). Live cells (SVF) were gated for CD11b positivity and intensity of F4/80 expression (blue—hi; green—lo). Ly6C expression was then measured for each population, CD11b+F4/80hi (blue) and CD11b+F4/80lo (green) cells. Red indicates CD11b negative cells. (B) Mature visceral adipose tissue macrophage (ATM) quantification—CD11b+F4/80hi. Compiled and analyzed flow cytometric data expressed as quantity per gram of adipose or as percent of live cells/SVF. (C). Immature myeloid cells (iMCs)—CD11b+F4/80lo cell quantification; Ly6C+ expression on iMCs from WT and CXCR−/− mice on a HFD. [Color figure can be viewed in the online issue, which is available at wileyonlinelibrary.com.]

