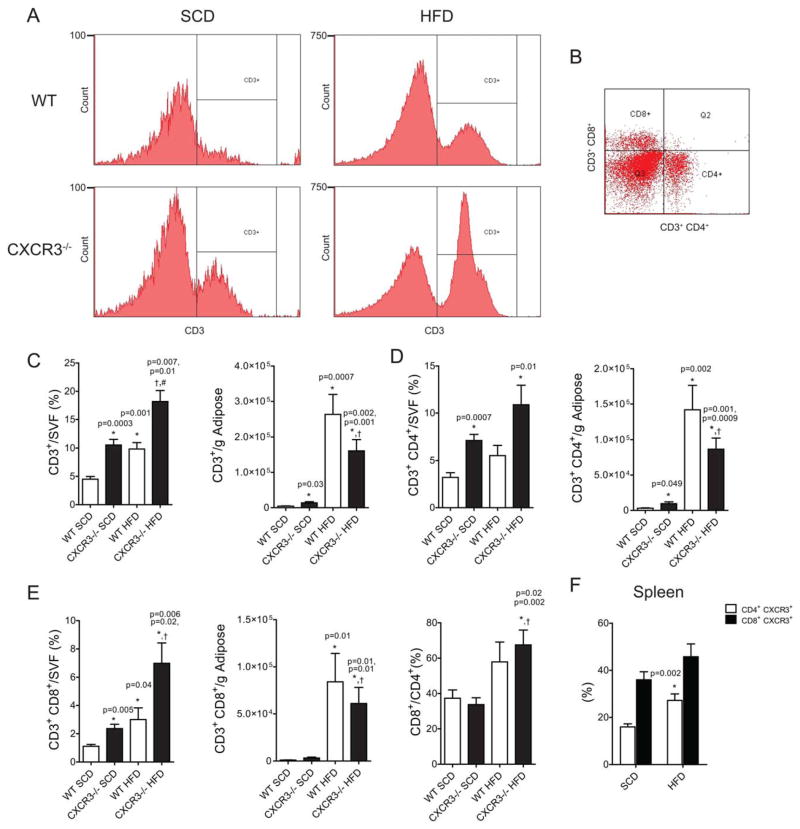
FIGURE 5.
Loss of CXCR3 enhances VAT T-cell content in lean and obese mice. (A) Representative flow cytometry histograms of CD3+ cell detection in the SVF of the epididymal adipose after tissue dissociation. (B) Separation of CD3+ cells by CD4 or CD8 positivity, representative dot plot. (C) CD3+ flow data expressed as percent of live cells/SVF from the adipose after dissociation or as a quantity per gram of adipose. (D) CD3+CD4+ flow data from the SVF. (E) CD3+CD8+ flow data from the SVF. (F) Splenic CD4 and CD8 cell expression of CXCR3, expressed as a percent of total CD4+ or CD8+ cells, respectively). [Color figure can be viewed in the online issue, which is available at wileyonlinelibrary.com.]

