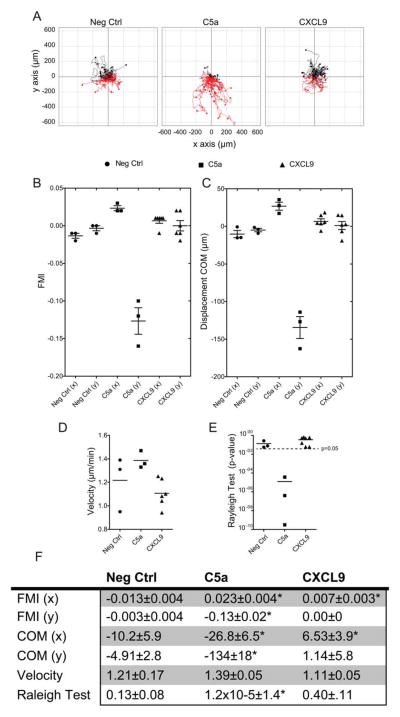
FIGURE 6.
Macrophages do not chemotax to the CXCR3 ligand, CXCL9. (A) Representative mBMM cell trajectory plots based on migration tracking of mBMMs in IBIDI® chamber slides. Groups include negative control (Neg Ctrl), positive control, complement component C5a (C5a), and the cytokine CXCL9 (CXCL9) over a 12-hour period. The y-axis is migration parallel to the gradient in μm. The x-axis is migration perpendicular to the gradient (μm). (B–E) Analysis of migration parameters. Each symbol represents a data point from the analysis of a single 12-hour migration. Sample size: Neg Ctrl & C5a n = 3; CXCL9 n = 6. (B) FMI = forward migration indices represented in x and y directions. See Methods for calculations. (C) Displacement COM = the displacement of COM shown from the same experiment as B. As in FMI, only the displacement in the y direction is significantly different than 0. (D) Average cell velocity of mBMMs. (E) RT P-values for homogeneity of cell distribution. The broken line represents the 0.05 significance threshold, indicating inhomogeneous (non-circular) cell distribution. (F) Table of migration data, *Indicates P < 0.05. [Color figure can be viewed in the online issue, which is available at wileyonlinelibrary.com.]

