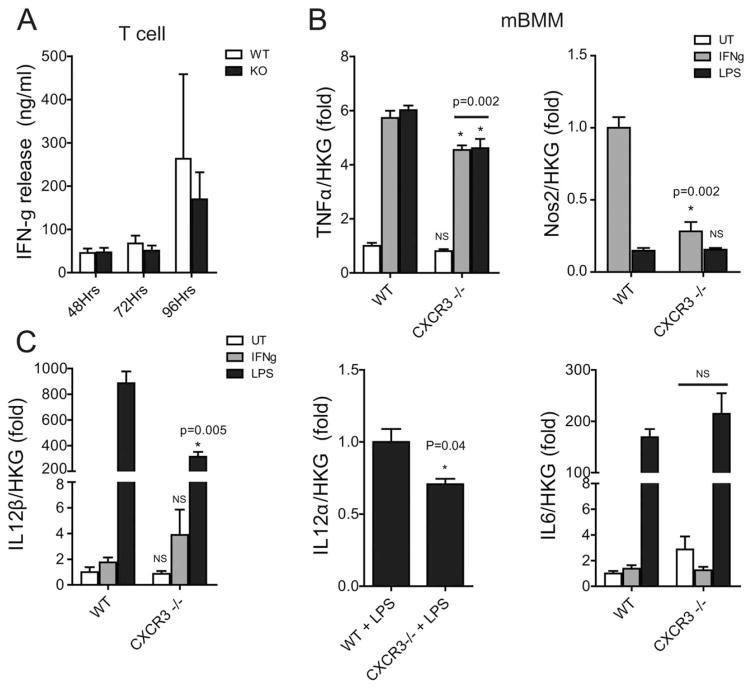
FIGURE 8.
Macrophages lacking CXCR3 have a disrupted IL-12/IFN-γ/NO axis. (A) ELISA measurement of interferon-γ release from splenic T cells isolated from WT and CXCR3−/− mice and cultured in the presence of anti-CD3 antibody stimulation for 48, 72, and 96 hours. (B) Relative gene expression in WT and CXCR3−/− mouse bone marrow-derived macrophages (mBMM): White bars indicate untreated/unstimulated (UT) macrophages, gray bars indicate IFN-γ, and black bars indicate LPS stimulation. Gene expression is relative to average house keeping gene (HKG) expression. All real-time values are expressed as a fold change. TNFα is normalized to untreated (UT) WT cells. Nos2 is normalized to WT-IFN-γ treated cells, as Nos2 is not expressed in UT cells. IL-12β is normalized to WT-UT. IL-12α is normalized to WT-LPS. IL6 is normalized to WT-UT. *Indicates comparison to WT with same treatment.

