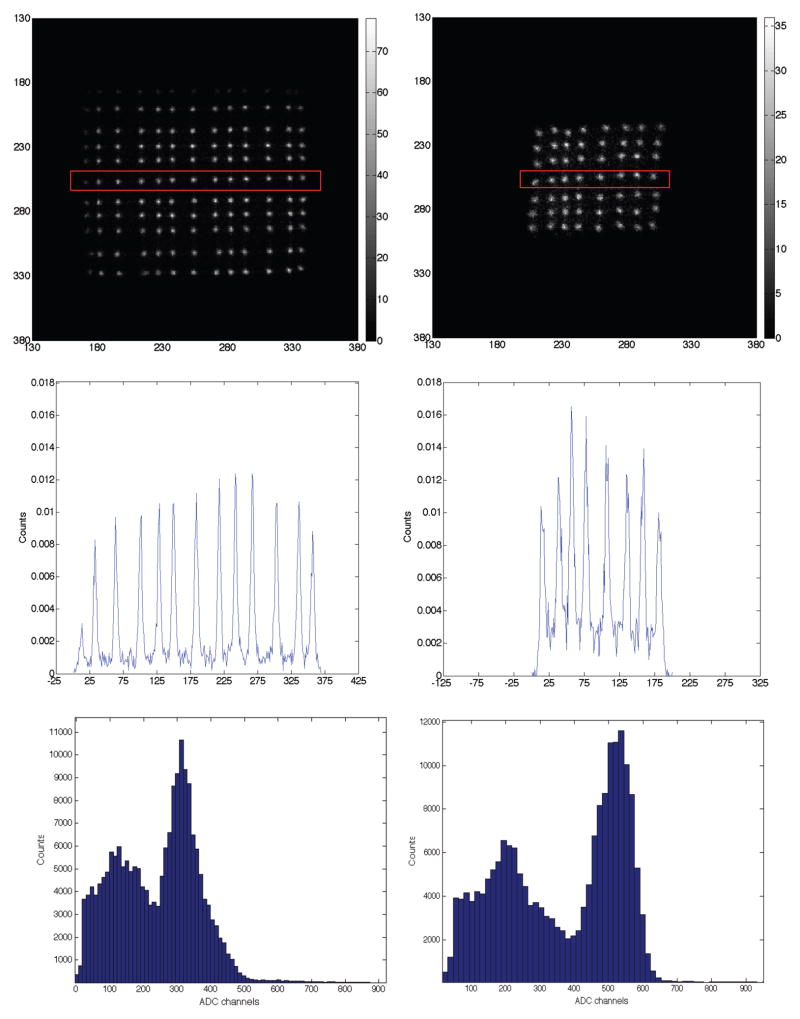
Fig. 5.
Top row: Flood images acquired with the 13 × 11, adhesive bonded, white plastic reflector array and the 8 × 7 diffuse sheet reflector array placed on the H8500 PMT. Middle row: Profiles drawn through a single row of crystals (indicated in red) from the flood images acquired above. Bottom row: Representative energy spectra from the above described arrays. The array assembled with the adhesive bonded, white plastic reflector shows a DOI dependent variation in light collection that results in a decrease in overall collected light. Left and Right columns show results for the 13 × 11, adhesive bonded, white plastic reflector array and the 8 × 7 diffuse sheet reflector array, respectively.

