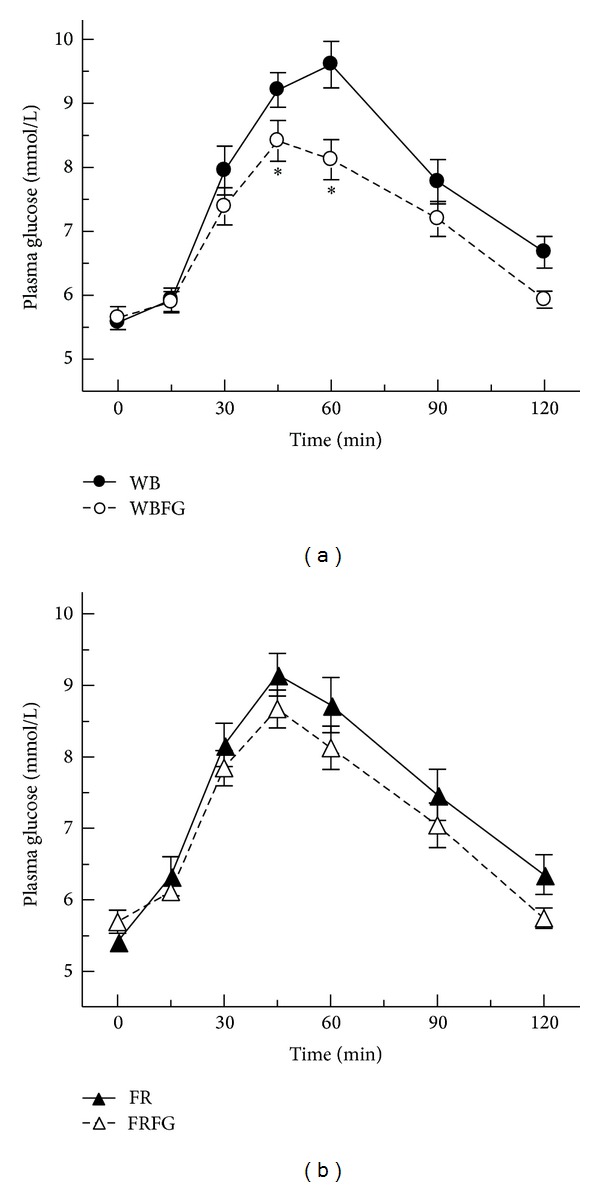
Figure 1.

(a) Mean plasma glucose response of white bread and white bread with fenugreek. Values are means ± SEM (n = 14). Comparison of plasma glucose concentrations (*P < 0.05). WB: white bread; WBFR: white bread with fenugreek. (b) Mean plasma glucose response of fried rice and fried rice with fenugreek. Values are means ± SEM (n = 14). Comparison of plasma glucose concentrations. FR: fried rice; FRFG: fried rice with fenugreek.
