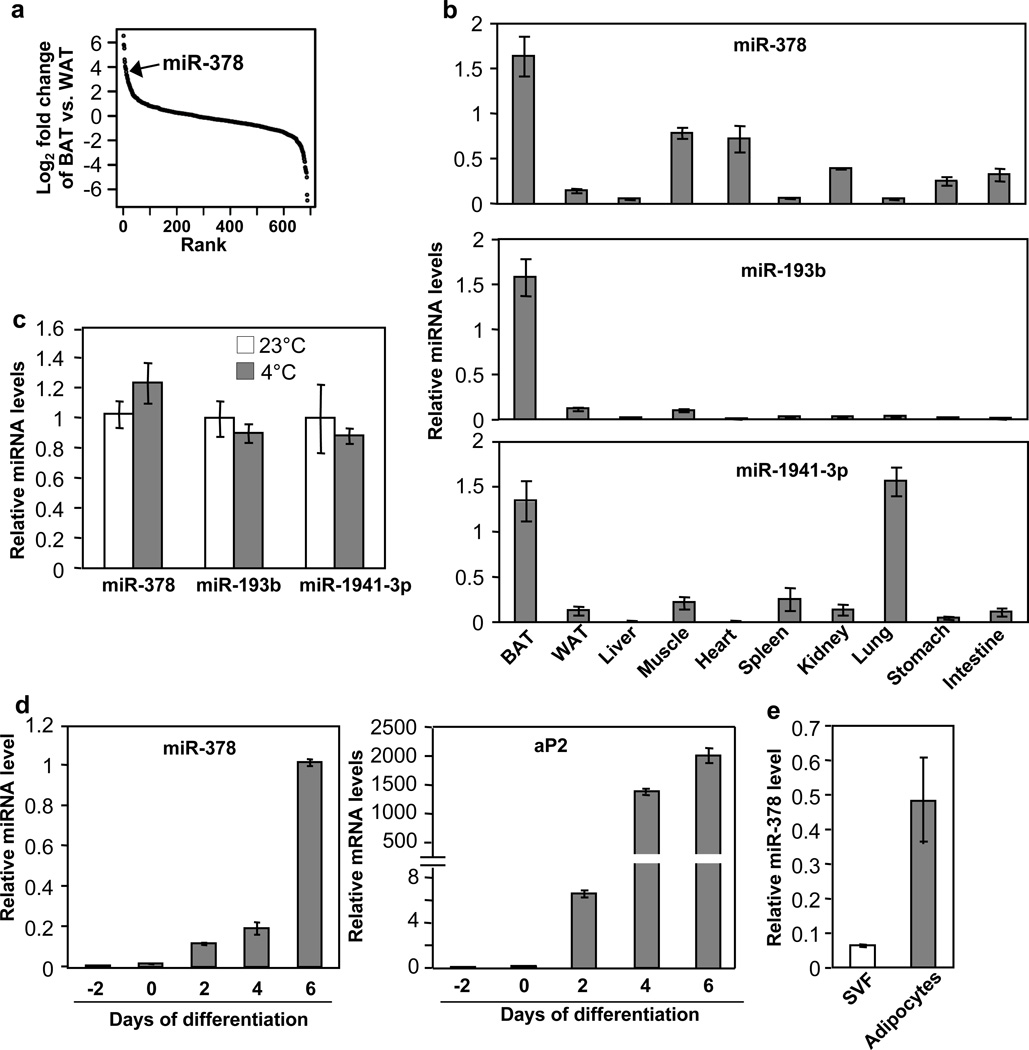
Fig. 1. Screening for BAT-selective miRNAs.
(a) miRNAs were ranked in order of differential expression between BAT and gonadal WAT (n=5 mice, 10-week-old male mice).
(b) miRNA tissue expression profile analyzed by quantitative RT-PCR. n=5 mice (10-week-old male mice).
(c) miRNA levels in BAT at 23°C and at 4°C (6 hr). n=5 mice per group (10-week-old male mice).
(d) miR-378 (left) and aP2 mRNA (right) levels during brown fat cells differentiation.
(e) miR-378 level in SVF and mature adipocytes isolated from BAT of wild type mice.

