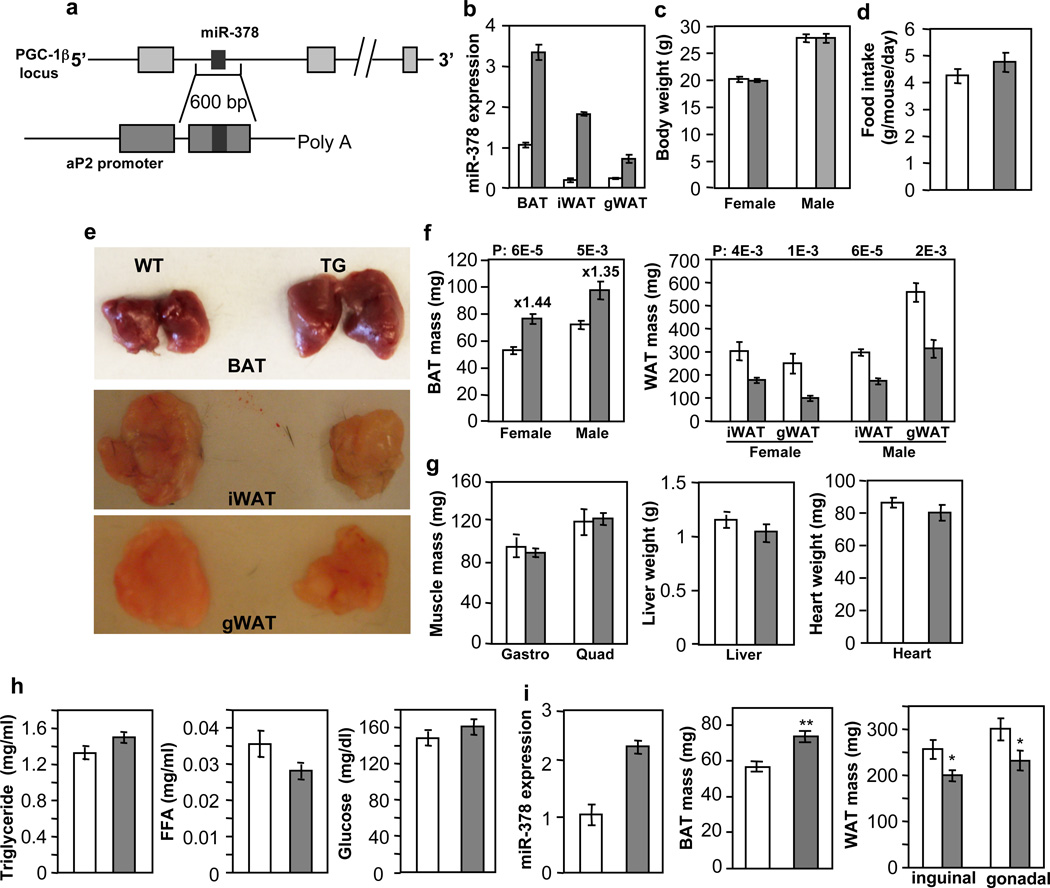
Fig. 2. Modest transgenic expression of miR-378 in adipose tissue produces a BAT-specific expansion.
Empty bar, wild type mice (WT); Grey bar, transgenic mice (TG). Mice were fed a normal chow diet.
(a) Outline of miR-378/378* transgenic construct.
(b) qPCR analysis of miR-378 levels in 9-week-old male WT and TG mice (n=3 mice per group). iWAT, subcutaneous inguinal WAT; gWAT, gonadal WAT.
(c) Body weights. Female, n=10–12 mice per group (9-week-old mice); male, n=6 mice per group (14-week-old mice).
(d) Food intake. n=5 male mice per group (10-week-old mice).
(e and f) BAT and WAT mass. Female, n=10–12 mice per group (9-week-old mice); male, n=6 mice per group (14-week-old mice). P values (TG vs. WT, two-tailed Student’s t-test) are indicated on top of the panels.
(g) Liver, skeletal muscle and heart weights from mice in (d). Gastro, gastrocnemius muscle; Quad, quadriceps muscle.
(h) Circulating triglycerides, free fatty acids and glucose levels. n=6–8 mice per group (14-week-old male mice).
(i) miR-378 expression and BAT expansion in a second miR-378 transgenic line. n= 6 mice per group (9-week-old male mice). *P<0.05, **P<0.005 (two-tailed Student’s t-test). All data are mean ± SE.

