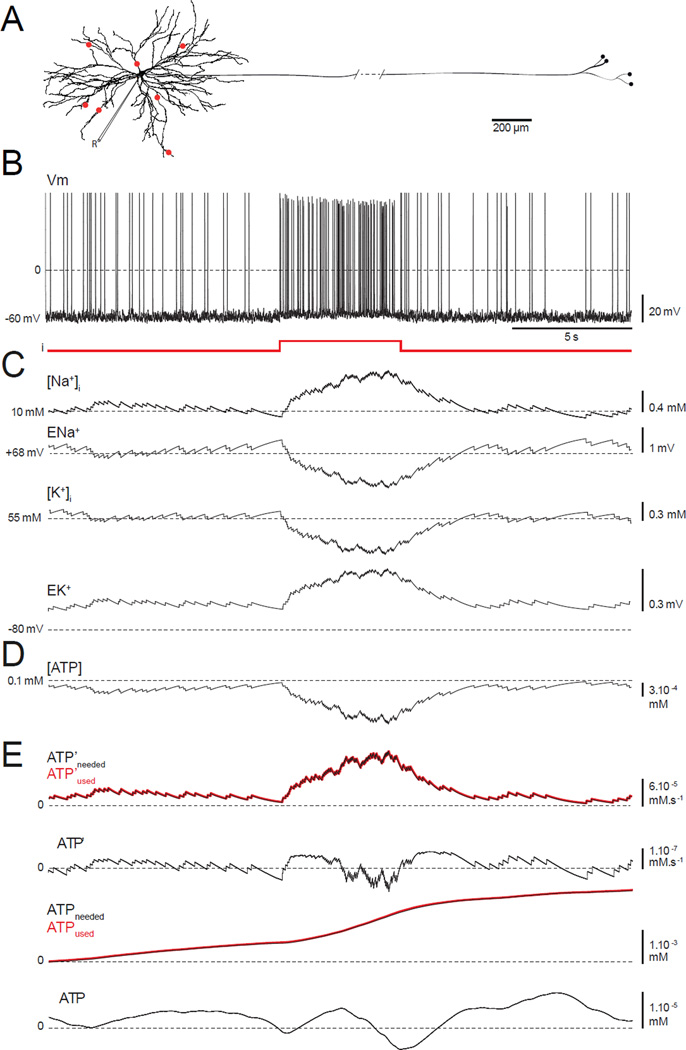
FIGURE 1. A model neuron combining conductance-based electrical activity, ion pumps, and pathways for ATP production and consumption.
(A) Model morphology based on Neuro Lucida reconstruction of a cat motor neuron. Red dots = synaptic inputs. “R” is for recording and shows where the measurements are made from.(B) Spontaneous membrane firing due to synaptic background. At 10 s, a 5 s depolarizing pulse is injected.(C) Evolution of the intracellular [Na+] ([Na+]i), the Na+ reversal potential (ENa+), the intracellular [K+] ([K+]i) and the K+ reversal potential (EK+).(D) Intracellular [ATP].(E) The amount of ATP used and needed per unit time, ATP’used (red line) and ATP’needed (black line). ΔATP’ is the difference between these quantities, ATPused and ATPneeded are their cumulative values, and ΔATP is the difference between ATPused and ATPneeded. ΔATP’ and ΔATP both fluctuate around 0, indicating that the model is stable.

