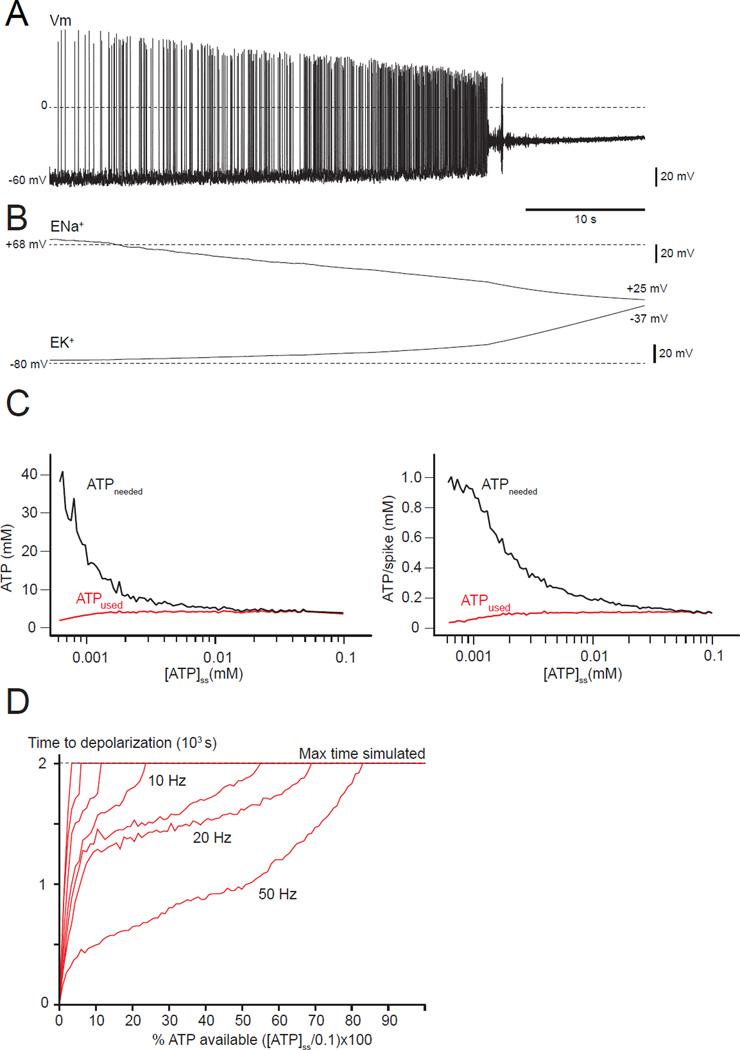
FIGURE 3. A deadly loop: A neuron with a severe deficit in [ATP]ss (0.001 mM) irreversibly depolarizes and further increases its energy needs.
(A) The membrane potential is unstable even for spontaneous activity, showing a progressive depolarization until APs stop due to sodium channel inactivation. (B) ENa+ and EK+ drift toward 0 as a consequence of the loss of ion gradients linked to the reduction in ATP-ase pumping. (C) ATPused and ATPneeded versus the ATP level ([ATP]ss). Lower [ATP]ss increases the amount of ATP needed (left panel), but not the amount used. The right panel shows the cost of a single AP for different levels of [ATP]ss. The amount of ATP needed for a single spike is greater when the ATP availability is lower.(D) Relationship between ATP deficit (x-axis), time to depolarization (y-axis) and average frequency firing (red lines between 10Hz and 50 Hz). The horizontal line at 2.0×10³ s represents the longest simulations explored. Even for low ATP deficit, a depolarization can occur after a very long time, and is even more likely if the average firing rate is high.

