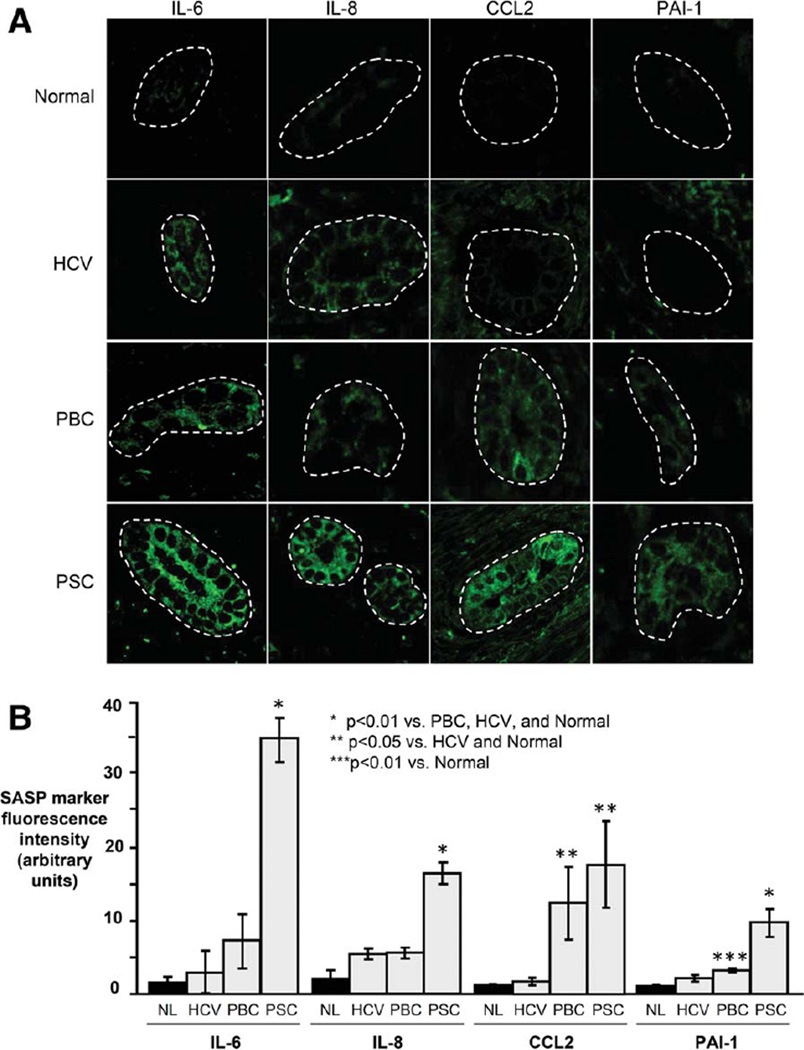
Fig. 3.
Cholangiocytes in PSC liver exhibit increased expression of SASP components. (A) Representative images of IL-6, IL-8, CCL2, and PAI-1 immunofluorescence in liver sections. (B) Semi-quantitative analysis of fluorescence intensity (presented as arbitrary units) demonstrates significantly increased cholangiocyte expression of SASP components in PSC.

