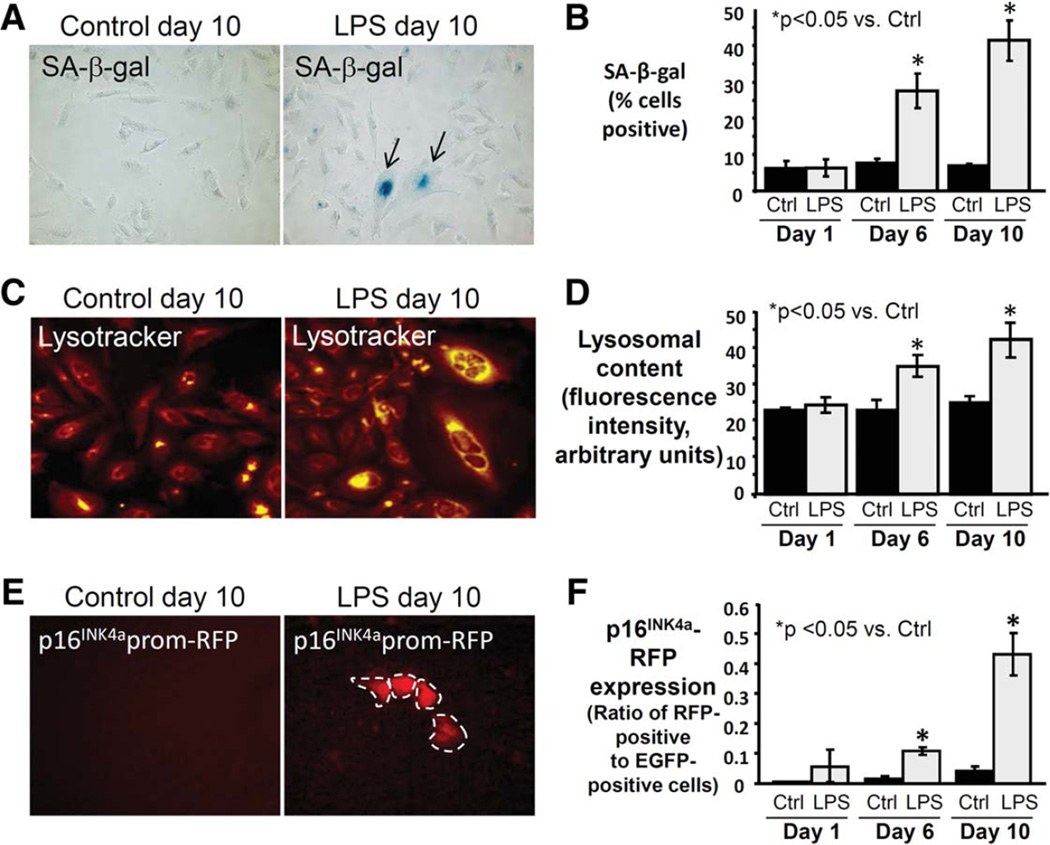
Fig. 5.
Persistent treatment with LPS induces expression of multiple senescence markers in NHCs. (A) Representative brightfield microscopy images at day 10 demonstrating increased LPS-induced SA-β-gal and cytologic features of senescence (larger size, squamoid appearance). (B) SA-β-gal quantitation reveals significantly increased proportion of SA-β-gal-positive NHCs following 6 and 10 days of LPS treatment. (C) Representative images at day 10 demonstrating increased LPS-induced lysosomal content. (D) Quantitation of lysosomal content reveals a significant increase in lysosomal content at day 6 and a further increase at day 10 compared to control. (E) Representative images at day 10 demonstrating LPS-induced expression of p16INK4a promoter-driven reporter (RFP). (F) Quantitation of p16INK4a (presented as the ratio of RFP to EGFP-positive cells) confirms a significant increase at day 6 and a further increase at day 10 compared to control.

