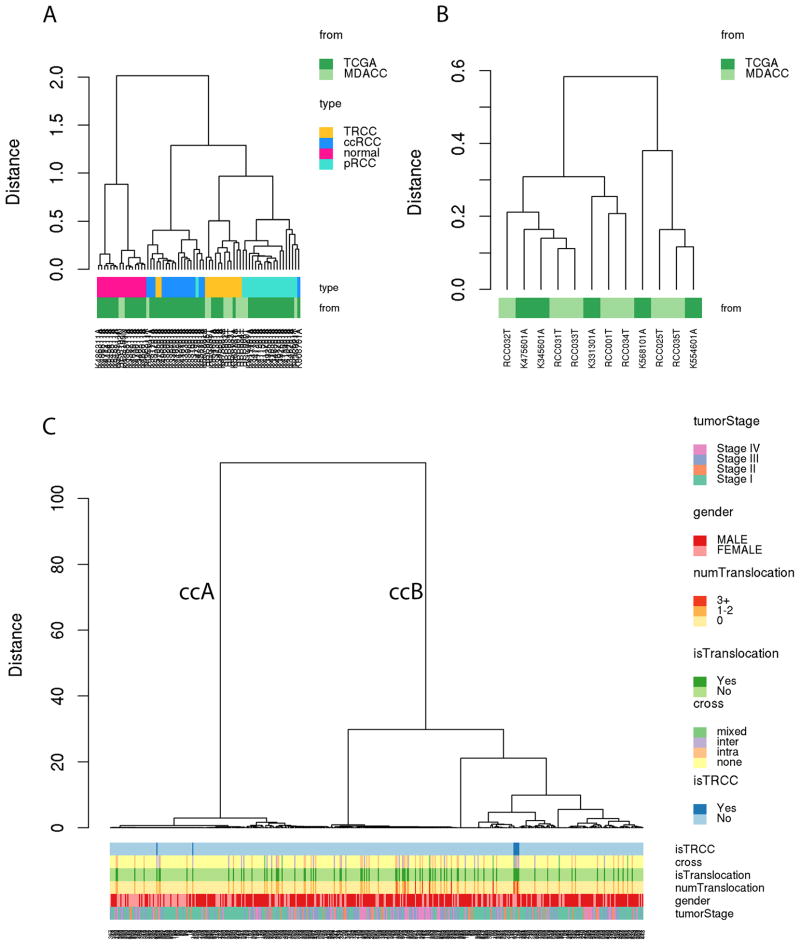
Figure 5.
A) Unsupervised clustering of MITF/TFE TRCC, ccRCC, papillary RCC, and normal kidney tissue revealing that TRCC displays a unique transcriptomic profile as compared to normal kidney and other RCC types. Note that the two possible minor clones among the TFE-related TRCC cases are clustered with other ccRCC samples. B) Unsupervised clustering of TRCC showing 2 subgroups with no samples clustered according to the TFE3 partner. C) Unsupervised clustering of gene expression of the 460 ccRCCs extracted from TCGA, showing the TRCCs clustered together within the ccB group, except the 2 cases that we defined as being TFE3 minor clones.

