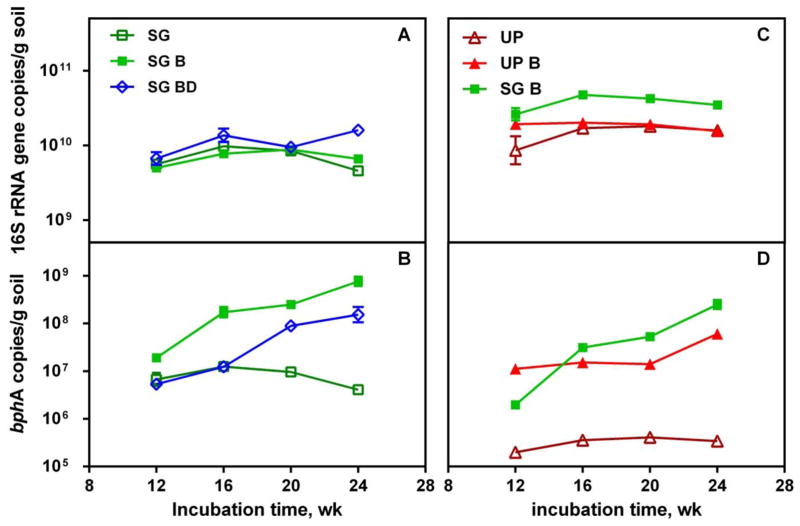
Figure 3.
qPCR analysis of bacterial 16S rRNA gene (A) and bphA (B) abundance with time in switchgrass treated soil (SG), switchgrass treated soil with bioaugmentation (SG B), switchgrass treated soil with autoclaved LB400 bioaugmention (SG BD); and bacterial 16S rRNA gene (C)and bphA (D) inunplanted soil (UP), unplanted soil with LB400 bioaugmentation (UP B), switchgrass treated soil with bioaugmentation (SG B). Error bars indicate the range of two soil subsamples from the same reactor.

