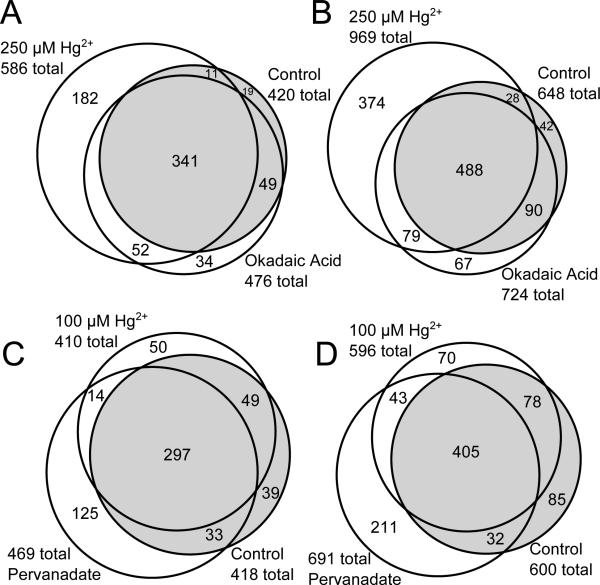
Figure 1.
Identification of phosphoproteins and phosphopeptides isolated from WEHI-231 cell. Proteins, panels A & C, or phosphopeptides, panels B & D, identified using TiO2-selected phosphopeptides from untreated cells or cells treated with 250 μM Hg2+ or 100 nM okadaic acid (A & B), or 25 μM pervanadate or 100 μM Hg2+ (C & D). Untreated sample regions are highlighted in grey. Numbers indicate total proteins identified in the group (A & C) or the number of unique phosphopeptides identified in the group (B & D). n = 3 (A & B) or 4 (C & D).

