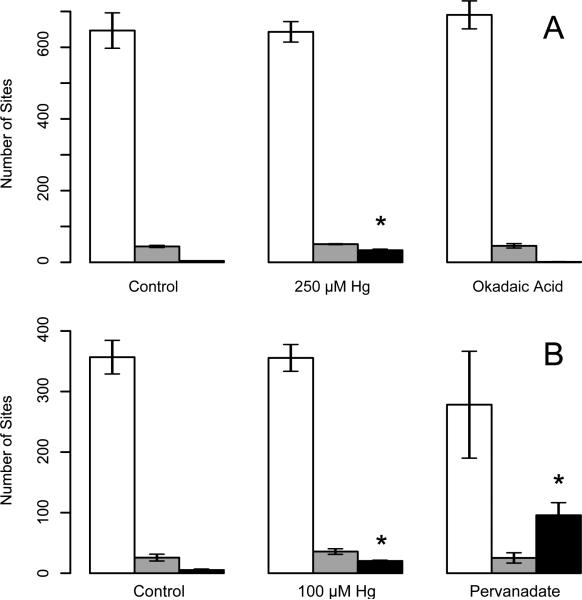
Figure 2.
Hg2+ and pervanadate increase tyrosine phosphorylation for Ascore-filtered sites. Panel “A” shows the number of pSer (white bars), pThr (grey) and pTyr (black) sites identified in each group for the first exposure condition, n = 3. Panel “B” shows similar data for the second exposure condition, n=4 ± Std. Dev, * indicates that pTyr is significantly different from control (t-test, p<0.05).

