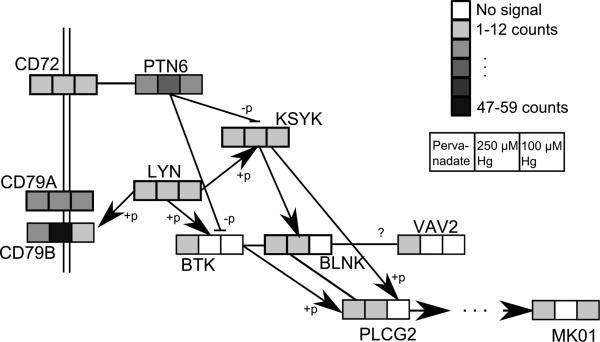
Figure 5.
Adaptation of the KEGG B-cell signaling pathway including protection spectral counts. Boxes indicate prevanadate, 250 μM Hg2+ and 100 μM Hg2+ with the color intensity showing the average total spectral counts for that protection. Control samples had 2 or fewer spectral counts for all proteins shown. Proteins are labeled by their Uniprot entry name with the suffix “_MOUSE” removed. +p and –p indicate phosphorylation and dephosphorylation.

