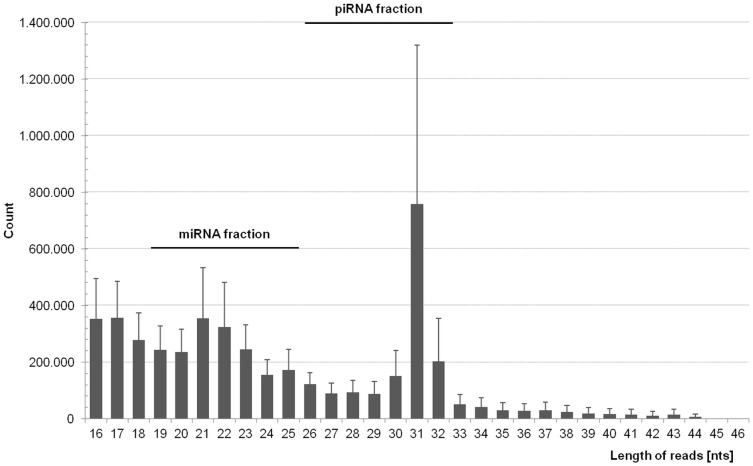
Figure 3. Sequence length distribution pattern analyzed by FastQC software.
Calculating the average number of sequences with a certain length for all nine plasma samples, the profile displayed a bimodal pattern. The first peak includes sequences with a length between 20 nts and 24 nts reflecting miRNAs. The second peak indicates the piRNA fraction with sequences of 29 nts to 33 nts in size.

