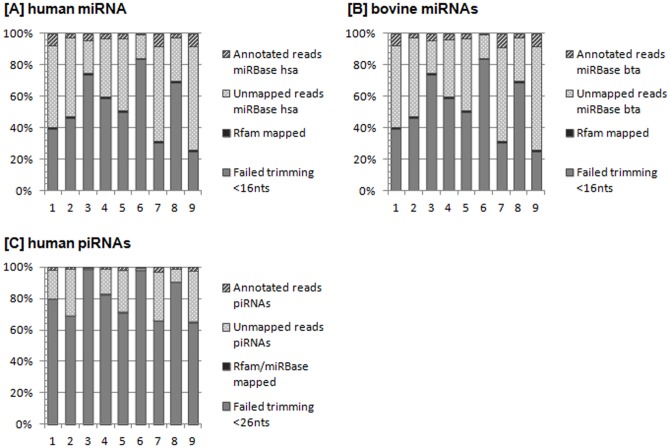
Figure 5. The proportions of trimmed, annotated and non-annotated reads.
The total number of sequenced reads (100%) is divided into reads that failed trimming and reads that passed trimming and were mapped to Rfam database. Reads that were not mapped to Rfam database, were mapped to miRBase. Reads separated into annotated reads in miRBase and in reads that failed miRNA annotation. Image [A] displays miRNA results from mapping to human reference indexes. Image [B] presents miRNA results from mapping to bovine references. Regarding piRNAs (Image [C]), reads that could not be mapped to miRBase were aligned to piRNA database. They separate into annotated piRNAs and unmapped piRNAs.

