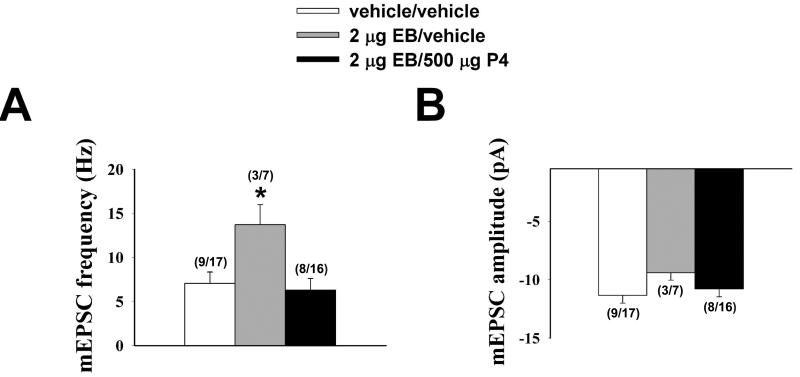
Figure 1.
Baseline mEPSC frequency but not amplitude is increased in ARH neurones from OVX rats 30 hr after EB priming, which was negated four hr after subsequent in vivo progesterone (P4) treatment. Bars represent means and vertical lines 1 S.E.M. of the basal mEPSC frequency and amplitude measured from recordings in slices from vehicle- (open columns), EB- (grey columns) and EB/P4-treated (black columns). The numbers in parenthesis refer to the number of animals (on the left) and the number of cells (on the right). * = P < 0.05, one-way ANOVA/LSD.

