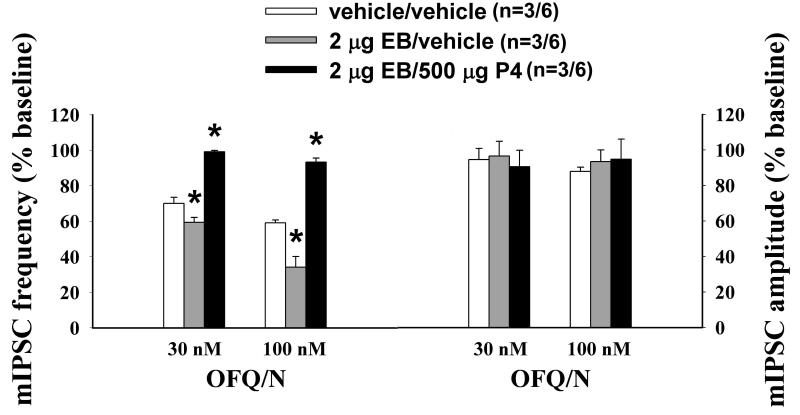
Figure 5.
Composite bar graph depicting the gonadal steroid modulation of the OFQ/N-induced decrease in mIPSC frequency. Bars represent means and vertical lines 1 S.E.M. of the mIPSC frequency and amplitude that were normalized to values observed under baseline conditions within their designated treatment groups. The numbers in parenthesis refer to the number of animals (on the left) and the number of cells (on the right). * = P < 0.05, rank-transformed multifactorial ANOVA/LSD.

