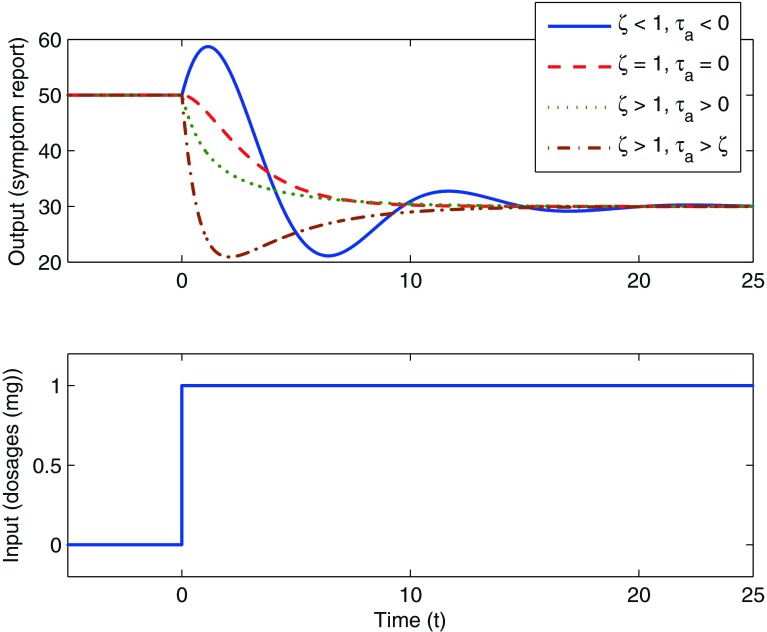
Fig 2.
Representative time-domain responses of an output following a “step” change in the input for a second-order system according to Eq. (1). In this case, a unit change in treatment dosage at time t = 0 results in a 20 magnitude decrease in a symptom report over time. Based on the system dynamics, the responses range from a decaying oscillation with inverse response (solid blue line) to increasing sluggish, nonoscillatory response (red (dash), green (dot), and maroon (dash-dot))

