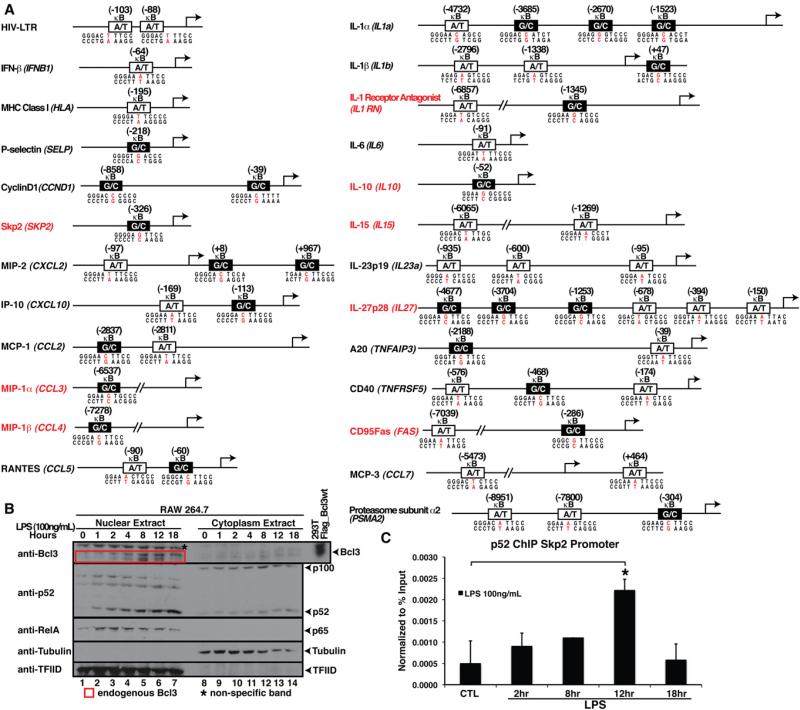
Figure 2. Promoter Architecture and LPS-Mediated NF-κB Activation.
(A) Identification of κB sites in the promoter/enhancer region of known NF-κB target genes. Genes with newly identified κB sites are indicated in red. A/T and G/C-centric κB sites are indicated by white and black boxes, respectively.
(B) Western blot analysis of nuclear and cytoplasmic extracts of RAW 264.7 cells after LPS stimulation for different times. RelA accumulation in the nucleus peaked between 1 to 2 hr of LPS stimulation; Bcl3 and p52 accumulated in the nucleus at later time points; peaked at 8–12 hr of LPS stimulation.
(C) ChIP assay showing p52 loading onto the Skp2 promoter in RAW 264.7 cells treated with LPS for the indicated times. *p < 0.05. Error bars represent SD. See also Figure S2 and Table S1.

