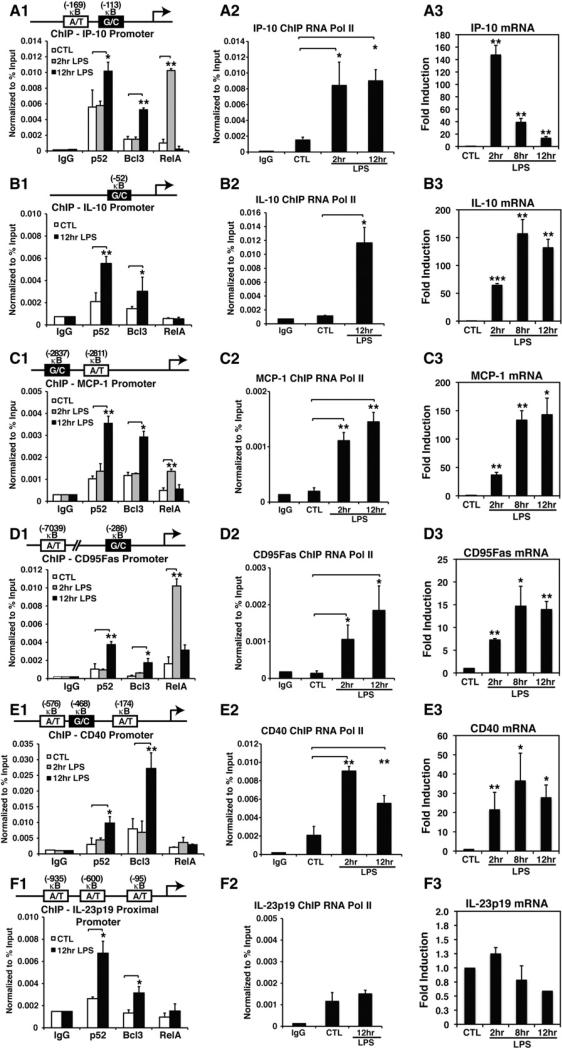
Figure 3. p52 and Bcl3 Binding to Endogenous Promoters, and Gene Activation upon LPS Stimulation.
(A1–F1) ChIP assay showing recruitment of p52, Bcl3, and RelA to indicated promoters at different times in RAW 264.7 cells untreated or treated with LPS for the indicated times.
(A2–F2) ChIP assay showing recruitment of RNA Pol II in RAW 264.7 cells treated with LPS at the indicated times. *p < 0.05, **p < 0.01.
(A3–F3) mRNA levels of the same set of genes monitored by qRT-PCR in RAW 264.7. **p < 0.01, ***p < 0.001 versus untreated controls. Error bars represent SD.
See also Figure S3 and Tables S1 and S2.

