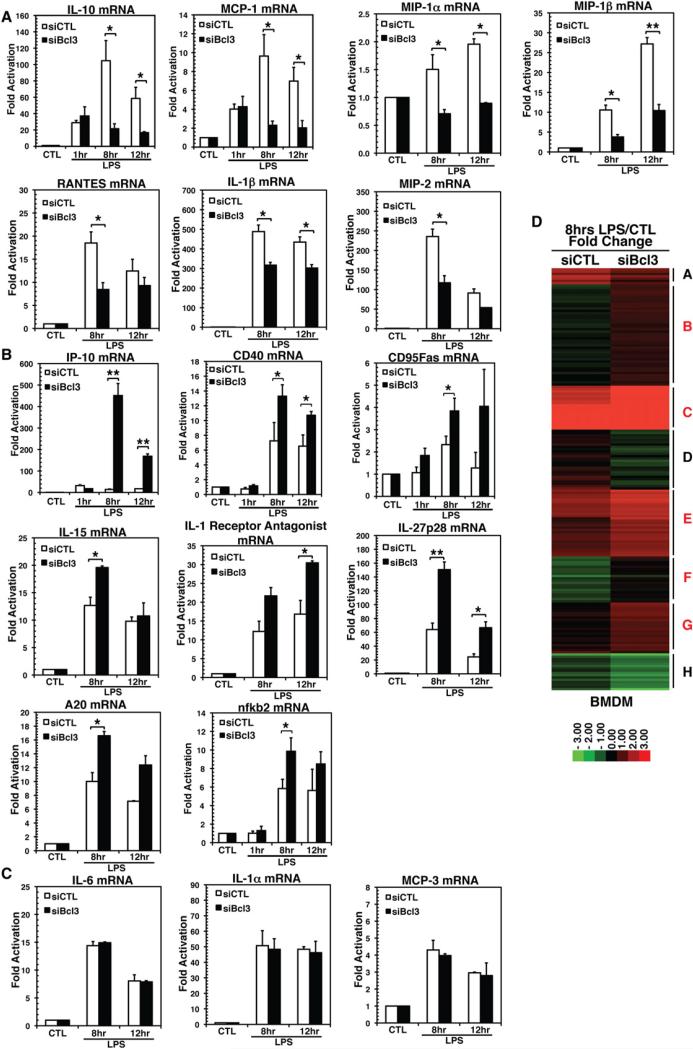
Figure 4. Bcl3 Is Essential for Target Gene Expressions.
(A–C) mRNA levels showing genes that are (A) downregulated, (B) upregulated, or (C) unaffected upon siBcl3 knockdown in BMDM by qRT-PCR analysis. *p < 0.05, **p < 0.01, ***p < 0.001 versus nontreated control or as indicated. Error bars represent SD.
(D) Microarray mRNA expression data from mouse scramble siRNA (siCTL) and siBcl3 BMDM cells stimulated with LPS (100 ng/ml) for 8 hr were analyzed by K-means clustering. Red represents stimulus-responsive gene induction, whereas green represents repression. Cluster identifiers are indicated on the right, with the red symbol indicating clusters with increased expression in siBcl3 cells compared with siCTL cells.

