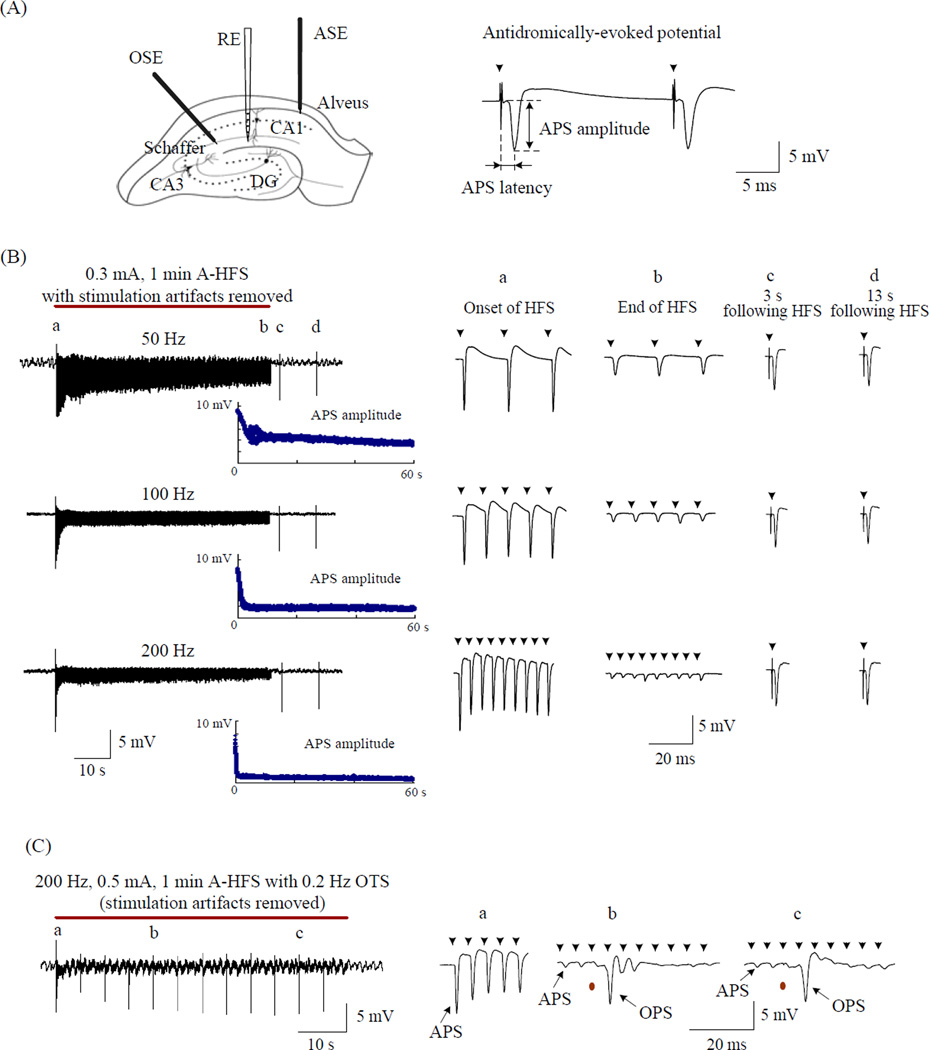
Figure 1.
Rapid recovery of APS suppression following A-HFS. (A) Schematic diagram of the locations of recording electrode (RE) in hippocampal CA1 region, antidromic-stimulation electrodes (ASE) in the alveus, and orthdromic-stimulation electrodes (OSE) in the Schaffer collaterals, and an example of a paired-pulse evoked APS with inter-pulse interval of 20 ms. (B) Left: Examples of wide-band (0.3 Hz - 5 KHz) recorded signals in the CA1 pyramidal layer during 1 min long (denoted by the red bar) of 50, 100 and 200 Hz A-HFS with stimulation intensity of 0.3 mA. Amplitude scatter diagram of each evoked-APS is drawn below. Right: Expanded evoked APS waveforms at the time indicated by “a” (the onset of HFS), “b” (the end of HFS), “c” 3 s following HFS and “d” 13 s following HFS. Although the APS was suppressed greater at the end of 200 Hz HFS than 50 and 100 Hz, it recovered quickly to a large amplitude similar to the 50 and 100 Hz HFS at 3s following the HFS. (C) OPS evoked by 0.5 mA orthodromic test stimuli (OTS) during a 200 Hz A-HFS. Expanded waveforms on the right show large OPS maintained when the APS were suppressed markedly. In the expanded plots, arrows above the waveforms denote the removed artifacts of A-HFS, and the red dots below waveforms denote the removed artifacts of OTS.

