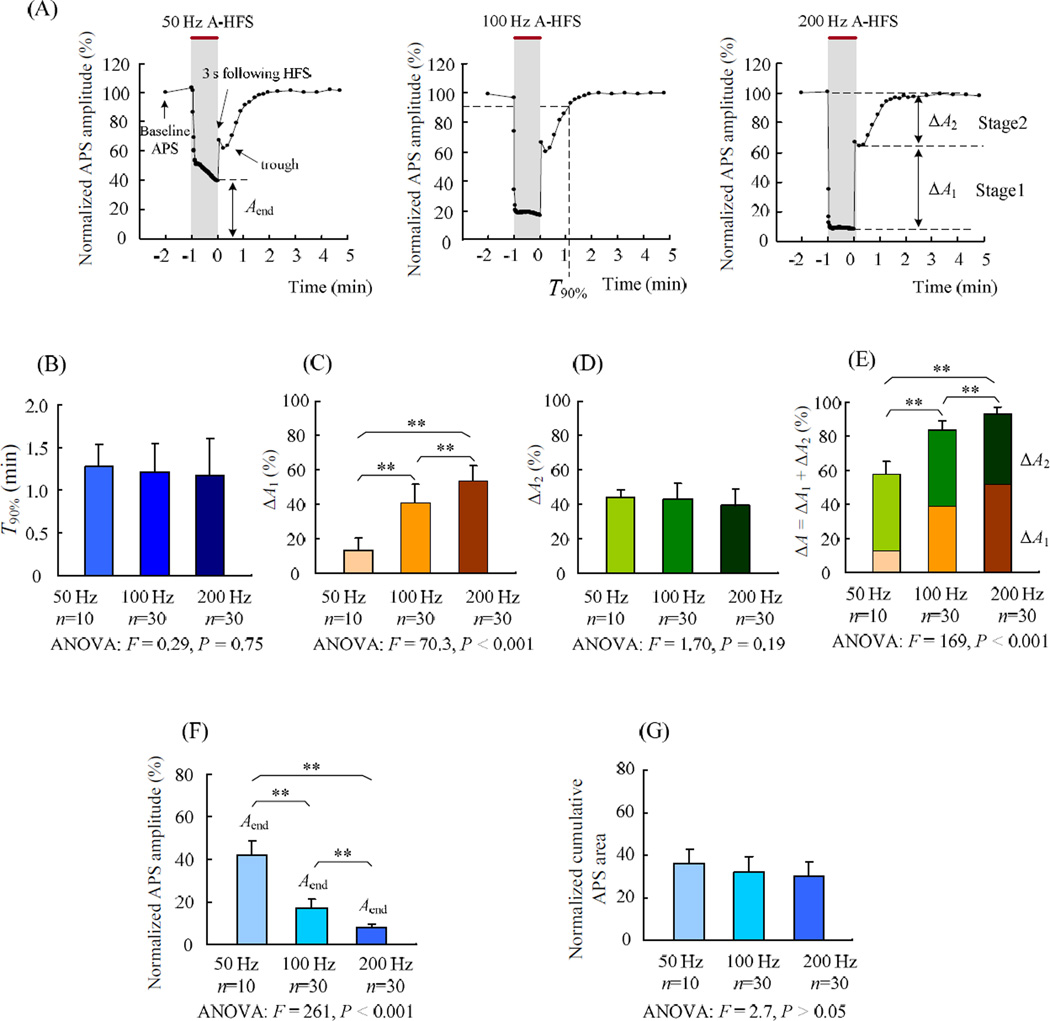
Figure 2.
Two recovery stages of APS following 1 min long A-HFS. The end of HFS was set as time 0. (A) Example curves of the APS amplitude normalized by baseline recording during and following 1 min long 50, 100 and 200 Hz A-HFS indicate that there were two distinct recovery stages of APS. Within 3 s following the HFS, the APS amplitude recovered rapidly (stage 1) Following stage 1, the APS dropped slightly before starting a slower recovery phase (stage 2). Shadings with red bars on top denote HFS durations. Each dot (except the 1st one) within the HFS period represents mean APS amplitude per second. The other dots following HFS represent each evoked APS. The two distinct stages in the recovery curves were separated by the lowest point after the 3 s point. (B) No significant difference in the recovery time T90% for 50, 100 and 200 Hz HFS was observed. (C) Recovery amounts of stage 1, ΔA1, significantly increased with the higher frequency. (D) There was no significant difference in the recovery amounts of stage 2, ΔA2, among the HFS groups. (E) Total amount of APS suppression, i.e., ΔA = ΔA1 + ΔA2, significantly increased with the higher frequency. (F) Mean APS amplitudes at the final 1 s of 1 min long HFS, Aend, significantly decreased with the higher frequency. (G) Cumulative APS areas within the final 1s of HFS normalized to the area of the 1st APS of HFS. The results of One-way ANOVA with Post hoc Bonferroni test are denoted in the plots of B – G: ** P < 0.001.

