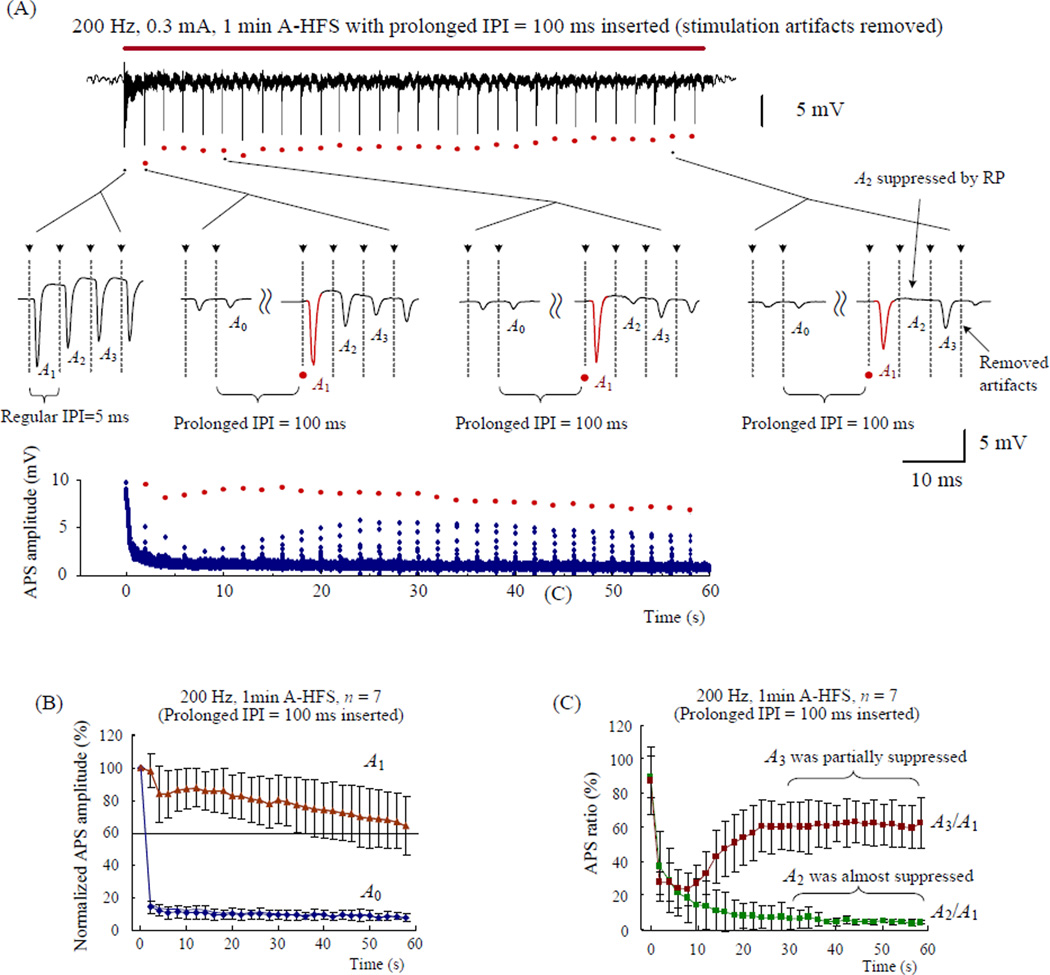
Figure 4.
The amplitude ratios of paired APS were used to assess the changes of refractory period during 200 Hz A-HFS trains. (A) Top: typical recording of 1 min long 0.3 mA 200 Hz A-HFS with prolonged IPI gaps inserted every 2 s. The red bar above the signal denotes the HFS durations. The red dots below the signal denote the evoked APSs subsequent to the gaps. Middle: expanded insets show the evoked APS waveforms at the onset of HFS (A2 ≈ A1) and around 3 examples of the total 29 gaps (A2 < A1). The APS waveforms subsequent to the prolonged IPI gaps (i.e., A1) are drawn by red color. The dashed lines with arrow heads in the expanded plots denote the location of the removed stimulation artifacts. Bottom: the scatter diagram of APS amplitude evoked by every stimulation pulse. The APS subsequent to the gaps (i.e., A1) are denoted by red dots. (B) Amplitudes of the preceding APS (A0) and subsequent APS (A1) to the gaps, normalized by the amplitude of the very first APS at the onset of HFS, indicate sufficient recovery of A1 while A0 was suppressed. (C) Ratios of A2/A1 and A3/A1 during HFS indicate that the refractory period extended to longer than 5 ms. Note: the regular interval of 200 Hz is 5 ms.

