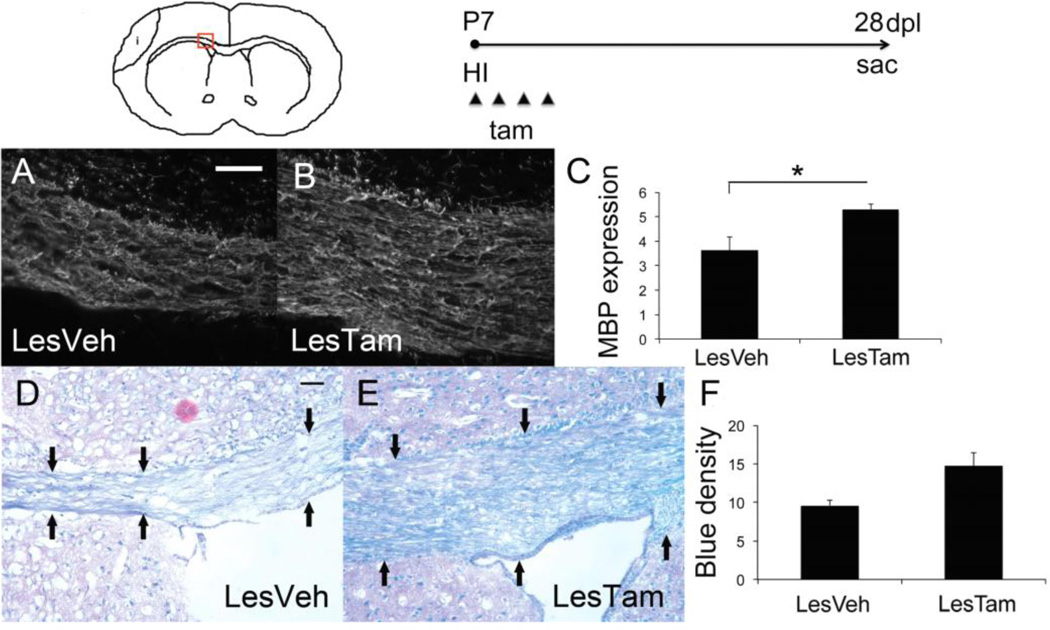
Figure 1. Loss of Dicer in NG2 expressing cells following hypoxia-ischemia results in increased mature oligodendrocytes and improved myelin.
Schematic of injury area and timeline of experimental procedure (i=infarct area, P=postnatal day, dpl=days post lesion, HI=hypoxia-ischemia, sac=sacrifice, tam=tamoxifen). Red box denotes area of corpus callosum imaged on coronal sections. Representative micrographs of myelin basic protein (MBP) staining within the corpus callosum of A) a lesioned mouse treated with vehicle (LesVeh), 40x, scale bar=25 µm, and B) a lesioned mouse treated with treated with tamoxifen (LesTam). C) Quantification of MBP expression within corpus callosum, error bars represent SEM, *p=0.048; n=4 LesVeh and 4 LesTam. Representative micrographs of Luxol fast blue (LFB) staining within the corpus callosum of D) a lesioned mouse treated with vehicle (LesVeh), magnification=20x, scale bar=25 µm, black arrows indicate edge of corpus callosum, and E) a lesioned mouse treated with tamoxifen (LesTam). F) Quantification of LFB expression within corpus callosum, error bars represent SEM; n=5 LesVeh and 4 LesTam.

