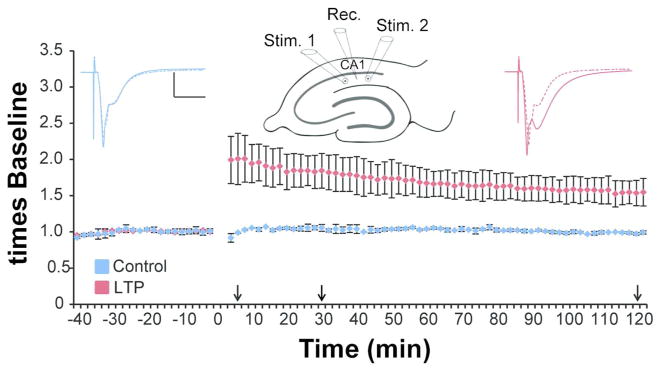
Figure 1.

Site-specific LTP was produced from electrodes positioned in stratum radiatum of hippocampal area CA1 and monitored for 5 min (n=3 slices from 3 animals), 30 min (n=3 slices from 3 animals), or 2 hr (n=2 slices from 2 animals) prior to rapid microwave-enhanced fixation. Waveforms are average responses from the control (blue) and TBS (red) stimulation sites, before (dashed lines) and 2 hr after (solid lines) TBS at one site. (Arrows indicate the times when slices were fixed, and scale bars = 5 mV/5 msec.) The graph plots the average responses from the 2 hr experiments. Similar graphs from experiments where the slices were fixed at 5 or 30 min post TBS are published in Bourne and Harris, 2011.
