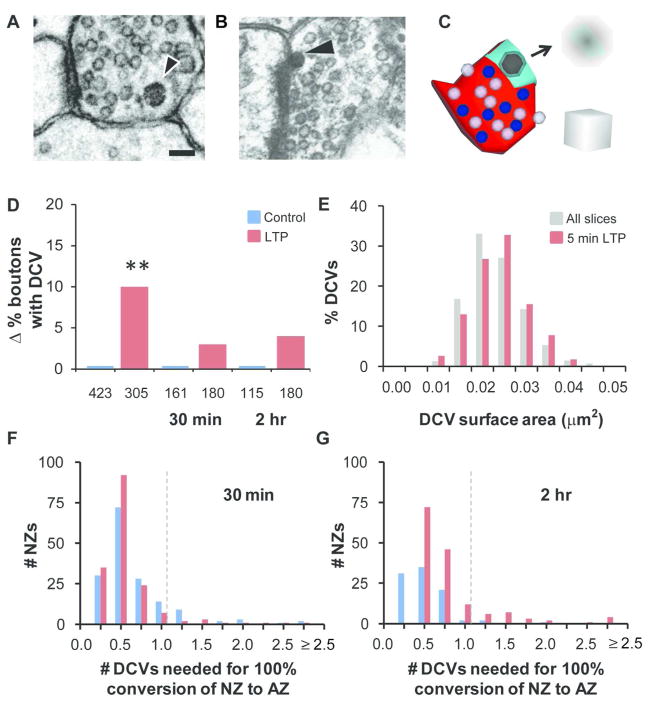
Figure 10.
Presynaptic dense core vesicles (DCVs) and nascent zone conversions during LTP. (A) DCVs were identified (arrowhead) in the presynaptic boutons of cross-sectioned synapses from slice experiments and combined for frequency analyses with findings from synapses sectioned in all orientations. (B) DCV (arrowhead) fusing with presynaptic membrane (image from a recovered mature hippocampal slice, previously published in Sorra et al., 2006). Scale bar in A is 100 nm for A–B. (C) Proposed DCV involvement in nascent to active zone conversion. 3D reconstruction with AZ (red), NZ (aqua), DCV (black), docked vesicles (blue), and neighboring nondocked vesicles (light purple). Arrow annotates DCV insertion and overlap at a nascent zone. Scale cube is 100 nm per side. (D) Comparisons to time-matched controls show an increase in the percentage of boutons with DCVs at 5 min after TBS (χ2 = 9.87, p < 0.01**; control 20%, n = 423 boutons; LTP 30%, n = 305 boutons), but not at 30 min (χ2 = 0.25, p = 0.62; control 43%, n = 161; LTP 46%, n = 180) or 2 hr during LTP (χ2 = 0.51, p = 0.47; control 30%, n = 115; LTP 34%, n = 180). Changes (Δ) were calculated by subtracting control percentages from LTP percentages at each time point. (E) DCV surface areas are plotted as percent of all the measured DCVs from slices (gray) and from just the 5 min LTP condition (red). The DCV diameters used to calculate DCV surface areas did not differ across slice conditions (main effects ANOVA, time point: F(2,822) = 0.44, p = 0.64; condition: F(1,822) = 2.36, p = 0.12, see also Table 2). (F, G) Individual NZ areas were divided by the overall mean DCV surface area in slices (0.021 ± 0.0002 μm2), and the resulting distribution of the number of DCVs that would be needed for their full conversion to AZ area is shown at (F) 30 min (control mean = 0.54 ± 0.03, LTP mean = 0.46 ± 0.02) and (G) 2 hr (control mean = 0.40 ± 0.03, LTP mean = 0.69 ± 0.05). Dotted line indicates 1 DCV necessary for full conversion.

