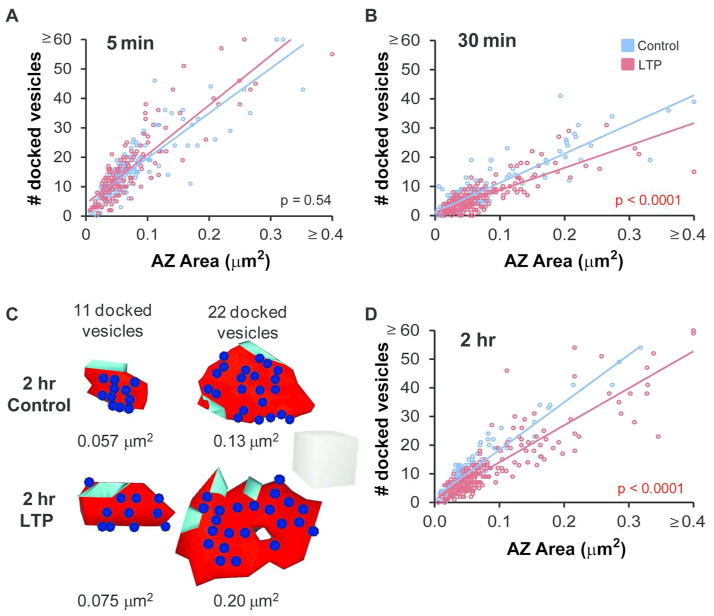
Figure 11.
The density of docked vesicles decreased as active zones were enlarged during LTP. (A) The density of docked vesicles per AZ area was correlated with PSD area and unchanged at 5 min after TBS relative to control stimulation (control, r = 0.86, p < 0.0001; LTP, r = 0.83, p < 0.0001; ANCOVA, F(1,327) = 0.37, p = 0.54). (B) By 30 min after TBS, the density of docked vesicles per AZ area remained well correlated with AZ area; however, the density decreased relative to control stimulation (control, r = 0.87, p < 0.0001; LTP, r = 0.79, p < 0.0001; ANCOVA, F(1,430) = 21.7, p < 0.0001). (C) 3D examples of small and large synapses illustrate representative docked vesicle distributions at AZs in the 2 hr control and LTP conditions. Scale cube, 200 nm per side. (D) Docked vesicle density remained well correlated with AZ area but decreased by 2 hr during LTP (control, r = 0.94, p < 0.0001; LTP, r = 0.89, p < 0.0001; ANCOVA, F(1,392) = 34.6, p < 0.0001). Several points were included in the AZ area ≥ 0.4 μm2 and docked vesicle number ≥ 60 categories, including: 5 min control (0.32 μm2, 75; 0.31 μm2, 65) and LTP (0.54 μm2, 55; 0.26 μm2, 62), 30 min control (0.52 μm2, 39) and LTP (0.49 μm2, 15), and 2 hr LTP (0.57 μm2, 59; 0.57 μm2, 69).

